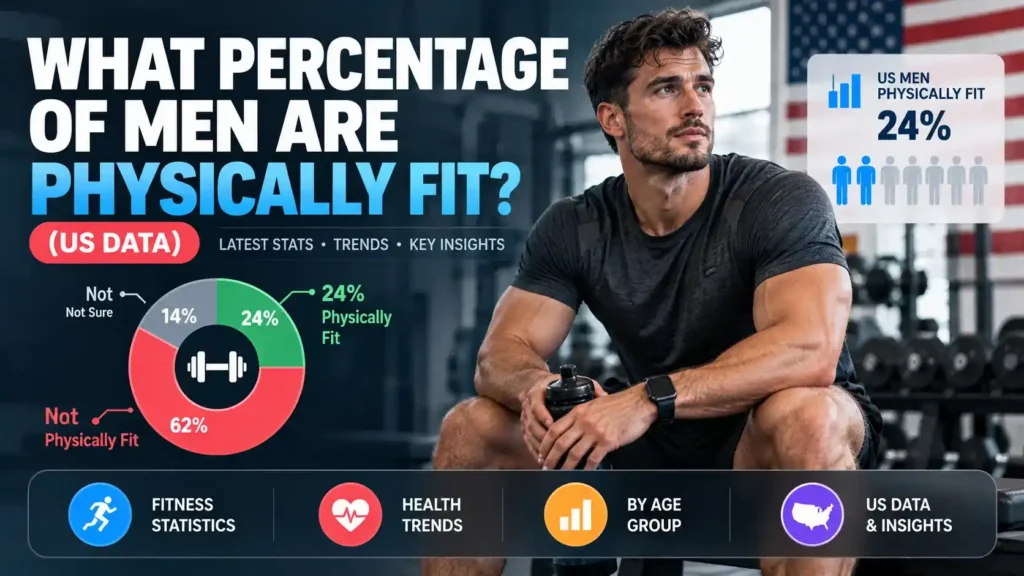
The gym selfies suggest one answer. The CDC’s own national health survey gives a very different one.
CDC / NCHS, 2024 Data
28.3%
of American men meet the full federal fitness guidelines
What percentage of men are physically fit in the United States? The honest answer, drawn directly from the Centers for Disease Control and Prevention’s own National Health Interview Survey, is smaller than most people expect. According to CDC data published in 2026 using 2024 survey results, only 28.3% of men aged 18 and older met the full federal physical activity guidelines, meaning both the aerobic exercise target and the muscle-strengthening target in the same period. That leaves roughly 7 in 10 American men falling short of what public health authorities actually define as an adequately active lifestyle.
Social media makes this number hard to believe. Fitness influencers, gym content, and physique transformation posts create a visual impression that a large share of men are in serious shape. The male fitness statistics tell a different, more grounded story, one shaped by desk jobs, long commutes, and a definition of “fit” that is more specific than most people assume.
This guide breaks down exactly how the CDC defines fitness, what the real numbers say by age group, how the figures compare to women, and what this data means if you are weighing physical fitness as part of a broader set of personal standards, whether that is for your own health goals or for evaluating dating preferences.
What Percentage of Men Are Physically Fit
According to the CDC’s National Center for Health Statistics, 28.3% of men aged 18 and older met the 2018 federal physical activity guidelines for both aerobic and muscle-strengthening activity, based on 2020 survey data reported in the agency’s most recent men’s health summary. This is the single most direct answer to what percentage of men are physically fit, since it reflects the government’s own combined definition of adequate physical activity, not a magazine’s opinion or a fitness brand’s marketing claim.
A separate, more recent CDC data brief using 2024 National Health Interview Survey results found that 52.3% of men met the aerobic activity guideline alone, compared to 42.4% of women. That gap between the two figures, roughly 52% meeting the aerobic-only standard versus 28% meeting the full combined standard, tells its own story: aerobic exercise like walking, running, or cycling is far more common among men than structured strength training.
Meet Both Standards
28.3%
Aerobic + strength, CDC
Meet Aerobic Only
52.3%
2024 NHIS, men 18+
Women, Aerobic Only
42.4%
2024 NHIS, women 18+
Men With Obesity
39.2%
Age 20+, CDC 2023
Key Takeaway: Depending on how strictly “physically fit” is defined, the answer ranges from about 1 in 4 men (28.3%, full CDC guideline) to roughly 1 in 2 men (52.3%, aerobic activity alone). Neither figure supports the impression that most men are in serious shape, and both figures come directly from federal health survey data rather than estimation.
How the CDC Actually Defines "Physically Fit"
Before trusting any statistic labeled physically fit men statistics, it matters to know exactly what standard is being measured. The federal Physical Activity Guidelines for Americans, most recently updated in 2018, set two separate benchmarks that together define adequate activity for adults:
Aerobic Activity Standard
At least 150 minutes per week of moderate-intensity activity (brisk walking, easy cycling) or 75 minutes per week of vigorous-intensity activity (running, fast cycling), or an equivalent combination of both.
Muscle-Strengthening Standard
Activities that work all major muscle groups, such as resistance training, weightlifting, or bodyweight exercises, on two or more days per week.
To count as meeting the full guideline, a person must satisfy both standards in the same reporting period, not just one. This is precisely why the aerobic-only figure (52.3%) is nearly double the combined figure (28.3%): plenty of men walk, jog, or bike regularly, but far fewer also do structured strength training twice a week on top of that.
It is worth noting that these guidelines measure activity levels, not physical appearance, body fat percentage, or athletic performance. A man can technically meet both standards while still carrying excess body fat, and a man who does not meet the aerobic minute threshold can still be muscular from strength training alone. “Physically fit” in the federal data sense is a measure of behavior, specifically whether someone moves enough and strength-trains enough, not a measure of how someone looks.
Male Fitness Statistics by Age Group
Physical activity is not evenly distributed across the male population. CDC survey data shows a consistent decline in the share of adults meeting aerobic activity guidelines as age increases, a pattern that holds for both sexes but has direct implications for anyone trying to understand fitness rates within a specific age bracket.
| Age Group | % Meeting Aerobic Guideline (All Adults) | Trend |
|---|---|---|
| 18 to 34 | 54.0% | Highest activity rate of any age group |
| 35 to 49 | ~48% | Declining as career and family demands increase |
| 50 to 64 | ~44% | Continued gradual decline |
| 65 and older | 38.4% | Lowest activity rate of any age group |
Source: CDC NCHS Data Brief No. 555, "Aerobic Physical Activity Among Adults Age 18 and Older: United States, 2024." Figures for 35 to 64 age brackets are interpolated from the reported overall decline pattern.
The CDC brief confirms a clear, consistent decline: activity levels drop from 54.0% among adults aged 18 to 34 down to 38.4% among adults 65 and older. Applied to men specifically, this means the 28.3% combined-guideline figure is itself an average across a wide age range, one that likely sits noticeably higher for men in their twenties and noticeably lower for men past retirement age.
Men vs Women: Who Is More Physically Active?
On the aerobic activity measure specifically, men consistently outpace women in CDC survey data. The 2024 NHIS data brief states plainly that men (52.3%) were more likely than women (42.4%) to meet aerobic physical activity guidelines, a gap of just under 10 percentage points that has held fairly steady across multiple survey years.
Older CDC survey rounds found a similar pattern for the combined aerobic-plus-strength standard, with men’s combined compliance rate running several points ahead of women’s. One contributing factor researchers have pointed to: men and women appear to report different underlying motivations for exercising, with men more frequently citing enjoyment of the activity itself and women more frequently citing weight management and appearance-related goals, a distinction that may affect how consistently each group sustains a routine over time.
| Measure | Men | Women |
|---|---|---|
| Aerobic guideline met | 52.3% | 42.4% |
| Combined guideline (aerobic + strength) | 28.3% | ~19% to 20% |
Sources: CDC NCHS Data Brief No. 555 (2024); CDC Men's Health FastStats summary citing 2018 guideline compliance from 2020 survey data. Women's combined figure is approximated from historical reporting of the gender gap on this measure.
Why So Few Men Meet Both Fitness Standards
The gap between 52.3% (aerobic alone) and 28.3% (both standards combined) is the most revealing detail in this entire dataset. It shows that the bottleneck for most men is not aerobic movement, which over half already manage, but structured strength training twice a week, which fewer than 3 in 10 manage consistently.
Several practical factors help explain this specific pattern:
- Aerobic activity is easier to fit into daily life. Walking to work, playing recreational sports, or commuting by bike all count toward the aerobic guideline without requiring a dedicated gym visit
- Strength training requires more deliberate planning. It typically demands equipment access, a specific time block, and often some baseline knowledge of technique, all of which raise the barrier to consistent participation
- America’s health status data compounds the picture. CDC figures show 39.2% of men aged 20 and older have obesity, and 50.8% have hypertension, both conditions strongly linked to insufficient physical activity over time
- Desk-based and sedentary work has become the norm. A large share of the workforce now spends the bulk of the day seated, removing a source of incidental activity that earlier generations built into their routines without thinking about it
What This Does Not Mean: None of this suggests men are lazy or uninterested in fitness. It suggests a structural gap between the activity that fits naturally into daily routines (walking, casual sports) and the activity that requires deliberate scheduling (strength training), with the second category losing out far more often when time is tight.
Why Social Media Distorts What "Fit" Looks Like
If the CDC’s own numbers say roughly 1 in 4 men meet full fitness guidelines, why does casual observation, especially on social media, suggest a much higher share of men are visibly fit? The answer is a basic sampling problem that applies to almost every visual platform.
People who are already fit, or who are actively documenting a fitness journey, are dramatically overrepresented in fitness-related content, gym photos, and physique posts, simply because those are the people motivated to create and share that content. Someone who does not exercise regularly has little reason to post workout content at all, which means the least active men are almost entirely invisible in the exact spaces where “how fit are men, generally” impressions get formed.
This is the same distortion that affects perception of height, income, and other population statistics: the visible, shared, discussed examples are never a random sample of the whole population, and treating them as one produces a badly skewed mental picture of what is actually typical.
The Other Side of the Data: Weight and Health Status
Activity guideline compliance is only one lens on male fitness. The CDC’s broader men’s health dataset adds important context that rounds out the picture of where American men actually stand physically.
Obesity Prevalence
39.2% of men aged 20 and older have obesity, according to CDC data covering August 2021 through August 2023. This runs roughly parallel to the low rate of guideline compliance, though obesity and activity level are related, not identical, measures.
Hypertension Rate
50.8% of men aged 18 and older have hypertension, either measured directly or via blood pressure medication use. Regular aerobic activity is one of the most well-documented non-drug interventions for managing this condition.
Self-Reported Health Status
14.2% of men rate their own health as fair or poor, a figure that has stayed relatively stable across the most recent years of CDC survey data.
Taken together, these figures paint a consistent picture: a meaningful majority of American men are not meeting the government’s own definition of adequate physical activity, and related indicators such as obesity and hypertension rates track in the same direction. None of these numbers describe any individual man, but as a population-level description, they are considerably less flattering than casual impressions suggest.
What This Means If Fitness Is a Personal Standard
Physical fitness is one of several traits that frequently shows up alongside height and income in discussions of dating preferences, sometimes summarized as the “6 foot, 6 figures, 6 pack” standard. Understanding the real population data behind each individual trait helps put that combined standard in proper context.
We have covered two of those three traits in detail elsewhere. Only about 14.5% of American men are 6 feet tall or taller, according to CDC NHANES measured height data, and roughly 25% of men earn $100,000 or more per year, according to Census and YouGov income data. Add the 28.3% who meet full federal fitness guidelines, and a preference that combines all three, if treated as independent and applied strictly, would statistically describe a fairly narrow slice of the male population.
This is not a judgment about whether such preferences are reasonable to hold, and the average American male height and typical body composition data show enormous natural variation regardless of activity level. It is simply useful, verified context for anyone thinking through their own standards with real numbers rather than assumptions. For a broader look at how these individual statistics interact and what the research says about modern dating expectations, see our companion pieces on whether women’s dating standards are too high and whether men’s dating standards are too high, and our detailed look at average male height in the US.
See How Fitness Combines With Other Standards
Reading population statistics one at a time is useful. Seeing exactly how your own combination of preferences, height, income, fitness, age range, and more, plays out against real US population data is a different and often more revealing exercise.
Calcxi offers two calculators built on this same verified data, depending on which perspective you want to explore:
Female Delusion Calculator
Enter dating preferences including height, income, and lifestyle standards, and see the precise percentage of American men who match every criterion at once, based on verified CDC and Census Bureau data.
Calculate My Dating Pool →Male Delusion Calculator
The reverse perspective: enter preferences for what men commonly look for in a partner, and see what percentage of American women statistically meet that same combined standard, using the same verified data sources.
Calculate the Other Side →Both tools apply the same principle behind every statistic in this article: real, sourced population data instead of guesswork or social media impressions.
Frequently Asked Questions
What percentage of men are physically fit in the US?
According to CDC data, 28.3% of men aged 18 and older meet the full federal physical activity guidelines, which require both 150 minutes of weekly aerobic exercise and muscle-strengthening activity on two or more days per week. A broader figure from 2024 CDC survey data shows 52.3% of men meet the aerobic guideline alone, without the strength training requirement. Which figure is “correct” depends on how strictly fitness is defined.
How many men meet CDC exercise guidelines for both aerobic and strength training?
28.3% of men meet both the aerobic activity guideline and the muscle-strengthening guideline in the same reporting period, according to CDC data drawn from the 2018 Physical Activity Guidelines and 2020 survey results. This combined figure is considerably lower than the percentage who meet the aerobic guideline alone (52.3%), showing that structured strength training, not aerobic movement, is the bigger gap in most men’s routines.
Are men more physically active than women?
Yes, according to CDC survey data. In the most recent 2024 National Health Interview Survey data, 52.3% of men met aerobic physical activity guidelines compared to 42.4% of women, a gap of just under 10 percentage points. Men have consistently outpaced women on this specific measure across multiple recent survey years, with research suggesting men more often report exercising for enjoyment while women more often report exercising for weight management, a difference that may affect long-term consistency.
What are the federal guidelines for being considered physically fit?
The Physical Activity Guidelines for Americans, last updated in 2018, define adequate activity as at least 150 minutes per week of moderate-intensity aerobic exercise (or 75 minutes of vigorous-intensity, or an equivalent mix), combined with muscle-strengthening activity covering all major muscle groups on two or more days per week. Meeting only one of the two components does not satisfy the full guideline; both are required together within the same period to count as meeting federal fitness standards.
Why does social media make it seem like more men are fit than the data shows?
Social media creates a sampling bias rather than an accurate cross-section of the male population. Men who are already fit, or who are documenting a fitness journey, have a strong reason to create and share workout or physique content, while the majority of men who do not exercise regularly have no comparable reason to post about it. This means the least active men are almost invisible in the exact content that shapes casual impressions of “how fit are men in general,” which inflates perceived fitness levels well above what CDC survey data actually shows.
What percentage of men have obesity in the United States?
According to CDC data covering August 2021 through August 2023, 39.2% of men aged 20 and older have obesity. This figure is broadly consistent with the low share of men meeting full federal fitness guidelines (28.3%), since insufficient physical activity is one of several contributing factors to obesity, though diet, genetics, and other lifestyle factors also play significant roles that activity data alone does not capture.
Published on calcxi.com · · Sources: CDC NCHS Men’s Health FastStats, CDC NCHS Data Brief No. 555 (2024), Physical Activity Guidelines for Americans (2018)

Written & verified by
B.Tech Computer Science · 8 years in web development & SEO · Bhilwara, India
About ·
LinkedIn ·
Report an error