
Break-Even Calculator
Work out how many units you need to sell to cover your costs, in units and in revenue, with a break-even chart, target profit, margin of safety and a multi-product mode. Works in any currency.
Rent, salaries, software, insurance. Costs that do not change with how much you sell.
What one customer pays you for one unit, before tax.
Materials, packaging, payment fees, shipping. Costs that rise with every extra sale.
| Goal | Units | Revenue |
|---|
| Price | Change | Break-even units | Break-even revenue |
|---|
Break-even moves far more than the input that caused it. That leverage is the whole reason to run this before changing a price.
Multi-product break-even
If you sell more than one thing, a single break-even number is meaningless on its own. Enter your product mix and this works out the weighted average contribution margin, then splits the break-even volume across the range. Mix is the ratio you sell them in, so 3 and 7 means three of the first for every seven of the second.
| Product | Price | Variable cost | Mix |
|---|
| Product | Share of mix | Units at break-even | Revenue |
|---|
How to use this break-even calculator
A break-even calculator answers one question: how much do you have to sell before you stop losing money? Three numbers get you there, and everything else on the form makes the answer more useful rather than more complicated.
Enter your fixed costs for one period
Rent, salaries, software, insurance, loan payments. Anything you pay whether you sell one unit or a thousand. Use a month if you think monthly, a year if you think annually, and keep every other figure on the same period.
Enter your selling price per unit
What one customer actually pays for one unit, after discounts and before sales tax. If you sell subscriptions this is the monthly price, not the lifetime value.
Enter your variable cost per unit
Materials, packaging, shipping, payment processing fees, per-unit commission. Everything that only exists because you made that one extra sale. This is the number most people get wrong, usually by forgetting card fees.
Add a target profit or expected sales if you have them
A target profit tells you the volume for a specific profit rather than for zero. Expected sales unlock your margin of safety, which is how far sales can fall before you are back in the red.
The break-even point formula
The break even point formula divides your fixed costs by what each sale contributes toward covering them. That second figure is the contribution margin, and the whole of break-even analysis rests on it.
Break-even point (units) = Fixed costs ÷ Contribution margin
Break-even point (revenue) = Fixed costs ÷ Contribution margin ratio
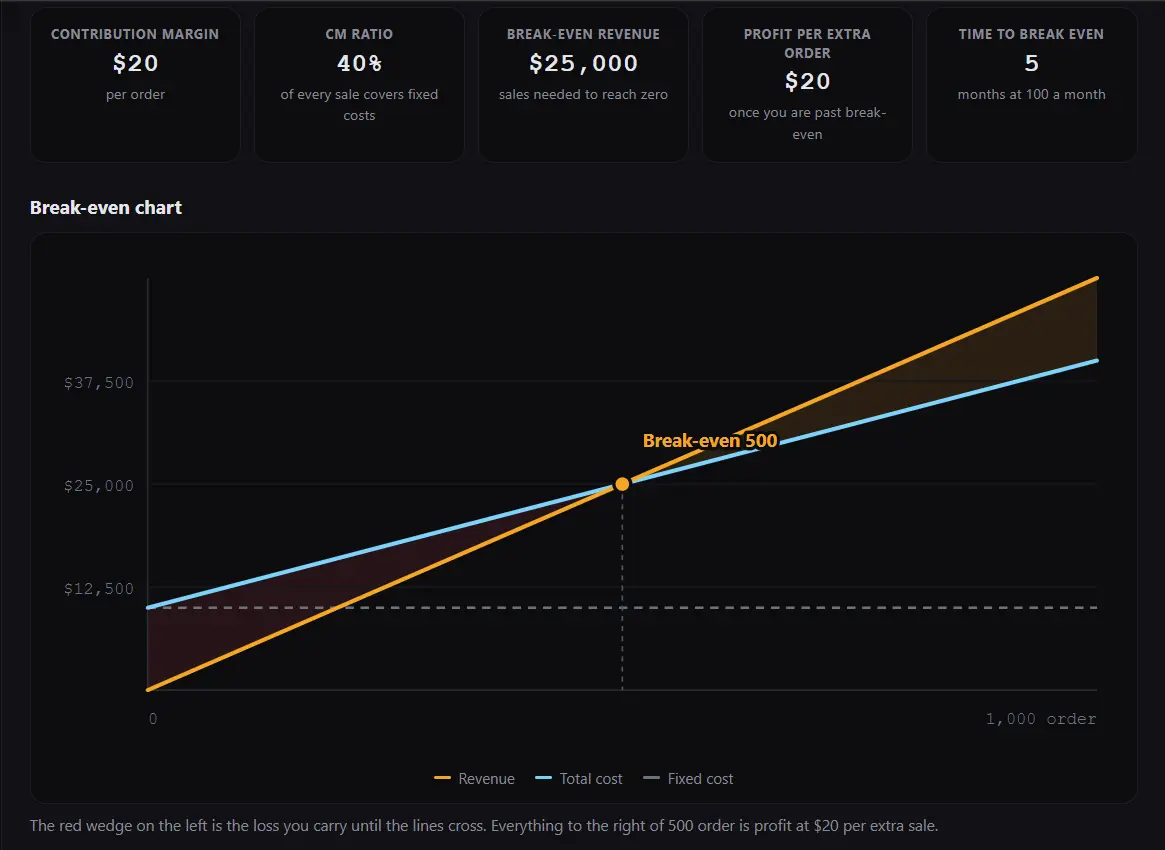
A worked example, which is the running example on this page. Fixed costs of $10,000 a month, a selling price of $50 and a variable cost of $30. The contribution margin is $20. Divide $10,000 by $20 and you get 500 units, or $25,000 of revenue. Sell 499 and you lose $20. Sell 501 and you make $20.
Why the contribution margin, not the profit margin
People often try to use gross profit margin here and get a number that is badly wrong. Gross margin includes some fixed costs in the cost of goods. Contribution margin deliberately excludes every fixed cost, because the entire point of the break even equation is to work out how many of those $20 contributions it takes to pay off $10,000 of costs that do not move.
How to calculate break-even point, step by step
People searching for how to calculate break even point are rarely stuck on the arithmetic, which is one division. They are stuck on the inputs, and that is where most break-even calculations go wrong.
Step 1: separate fixed from variable properly
Ask one question about every cost: does this change if I sell one more unit tomorrow? Rent does not, so it is fixed. Shipping does, so it is variable. Some costs are genuinely both, like a phone plan with overage, or a salaried worker who gets paid overtime in busy months. Split those: put the base in fixed and the per-unit part in variable.
Step 2: do not forget the fees
Payment processing is the most commonly missed variable cost. On a $50 sale, around 2.9% plus 30 cents is roughly $1.75, which is nearly nine percent of a $20 contribution margin. Marketplace commission, affiliate payouts, packaging and return shipping belong here too.
Step 3: divide, then round up
Fixed costs divided by contribution margin. Always round up, because selling 1,212.1 cups of coffee is not a thing. The calculator above rounds up for you.
Step 4: sanity check it against reality
Turn the answer into something you can picture. A coffee shop breaking even at 1,213 cups a month is 41 cups a day, which is either obviously fine or obviously impossible depending on the shop. That translation is what turns a number into a decision.
Break-even examples across different businesses
The same break even formula covers a coffee shop and a software company. The only thing that changes is what counts as a unit.
| Business | Fixed costs | Price | Variable | Contribution | Break-even | Revenue |
|---|---|---|---|---|---|---|
| Coffee shop | $4,000 | $4.50 | $1.20 | $3.30 | 1,213 cups | $5,455 |
| SaaS product | $20,000 | $49.00 | $6.00 | $43.00 | 466 subscribers | $22,791 |
| Freelance design | $3,000 | $750.00 | $50.00 | $700.00 | 5 projects | $3,214 |
| Ecommerce store | $8,000 | $35.00 | $14.00 | $21.00 | 381 orders | $13,333 |
| Print shop | $12,000 | $120.00 | $45.00 | $75.00 | 160 jobs | $19,200 |
Look at the freelance design row. A contribution margin of $700 on a $750 project means five projects a month covers everything. Compare that with the ecommerce store, which needs 381 orders for the same kind of fixed cost base. Neither is better. They are different shapes of business, and the break-even point is the clearest single number for telling them apart.
Break-even analysis in revenue rather than units
Not every business has a tidy unit. An agency, a restaurant with fifty menu items or a consultancy is easier to model in revenue. For that you use the contribution margin ratio.
Break-even revenue = Fixed costs ÷ Contribution margin ratio
On the running example the ratio is $20 divided by $50, which is 40%. Forty cents of every dollar of sales is left after variable costs to pay down fixed costs. Divide $10,000 by 0.40 and you get $25,000, the same answer the unit method gave, which is a useful check that you have not mixed up your inputs.
The ratio is also the fastest way to compare two businesses of different sizes. A software company at 87.8% and a grocery retailer in single digits are playing completely different games, and the ratio says so in one number.
Break-even with a target profit
Break-even is rarely the actual goal. Nobody opens a business to make zero. The same break even equation gives you the volume for any profit you name, by treating that profit as one more cost you have to cover.
| Goal | Units needed | Revenue needed |
|---|---|---|
| Break even | 500 units | $25,000 |
| Profit of $2,000 | 600 units | $30,000 |
| Profit of $5,000 | 750 units | $37,500 |
| Profit of $10,000 | 1,000 units | $50,000 |
| Profit of $25,000 | 1,750 units | $87,500 |
Notice the shape of that table. Going from break-even to a $5,000 profit costs you 250 extra units, and going from $5,000 to $10,000 costs you another 250. Once fixed costs are covered, profit grows in a straight line at exactly the contribution margin per unit. That is why the first sale past break-even is worth so much more than the last sale before it.
Margin of safety: how much room you actually have
Break-even tells you where the floor is. Margin of safety tells you how far above it you are standing, which is usually the more useful thing to know.
Margin of safety % = Margin of safety ÷ Actual sales
| Volume | Revenue | Profit | Margin of safety | Operating leverage |
|---|---|---|---|---|
| 400 units | $20,000 | $-2,000 | -25% | -4 |
| 500 units | $25,000 | $0 | 0% | undefined |
| 600 units | $30,000 | $2,000 | 16.7% | 6 |
| 800 units | $40,000 | $6,000 | 37.5% | 2.67 |
| 1,000 units | $50,000 | $10,000 | 50% | 2 |
| 1,500 units | $75,000 | $20,000 | 66.7% | 1.5 |
What operating leverage is telling you
Operating leverage is the contribution margin divided by operating income, and it says how much faster profit moves than sales. At 800 units the figure is 2.67, so a 10% rise in sales lifts profit by roughly 27%. That sounds like good news until sales fall 10% instead and profit drops 27%.
Read the two columns together. Just above break-even, margin of safety is thin and operating leverage is enormous, which is the most fragile place a business can sit. As volume grows, safety rises and leverage settles down. A business at 1,500 units with a 66.7% margin of safety can lose two thirds of its sales before it is in trouble.
What happens when your price or costs change
This is the question everyone asks straight after seeing their break-even point, and no calculator in the top results answers it. Small moves in price cause large moves in break-even, because price changes hit the contribution margin rather than the revenue line.
| Price | Change | Contribution | Break-even | Move |
|---|---|---|---|---|
| $40.00 | -20% | $10.00 | 1,000 units | +100% |
| $45.00 | -10% | $15.00 | 667 units | +33.3% |
| $47.50 | -5% | $17.50 | 572 units | +14.3% |
| $50.00 | base case | $20.00 | 500 units | |
| $52.50 | +5% | $22.50 | 445 units | -11.1% |
| $55.00 | +10% | $25.00 | 400 units | -20% |
| $60.00 | +20% | $30.00 | 334 units | -33.3% |
A 10% price cut raises break-even by 33%. A 10% price rise lowers it by 20%. That asymmetry is the single most important thing on this page for anyone thinking about discounting. Offering 10% off does not cost you 10%, it costs you a third of your safety margin, and you need a third more customers just to stand still.
Fixed costs move it in a straight line
| Fixed costs | Change | Break-even | Revenue |
|---|---|---|---|
| $8,000 | -20% | 400 units | $20,000 |
| $9,000 | -10% | 450 units | $22,500 |
| $10,000 | base case | 500 units | $25,000 |
| $11,000 | +10% | 550 units | $27,500 |
| $12,000 | +20% | 600 units | $30,000 |
Fixed costs are the well behaved input: a 20% rise moves break-even by exactly 20%. Price is not, which is why a price decision deserves this table and a rent decision mostly does not.
Break-even analysis for multiple products
Most real businesses sell more than one thing, and a single break-even number stops meaning anything the moment they do. The standard fix is the weighted average contribution margin: work out the average contribution across your actual sales mix, then divide fixed costs by that.
Break-even units = Fixed costs ÷ Weighted average CM
A cafe with $26,000 of fixed costs sells seven coffees for every three sandwiches. Coffee contributes $3.30, sandwiches contribute $5.50. The weighted average across that mix is $3.96, so break-even is 6,566 items and $38,409 of revenue, split like this:
| Product | Contribution | Share of mix | Units at break-even | Revenue |
|---|---|---|---|---|
| Coffee | $3.30 | 70% | 4,596 | $20,682 |
| Sandwich | $5.50 | 30% | 1,970 | $17,727 |
The catch nobody mentions
This answer is only valid while the mix holds. If customers start buying more sandwiches and fewer coffees, the weighted average contribution rises and the break-even point falls, without anybody changing a price. Your break-even point moves when your customers change their minds, which is why it is worth recalculating whenever the mix shifts noticeably.
How to read a break-even chart
The chart in the calculator above draws three lines and the whole of break-even analysis is in where they sit relative to each other.
The revenue line
Starts at zero, because selling nothing earns nothing, and climbs at your selling price per unit. The steeper it is, the sooner it catches total cost.
The total cost line
Starts at your fixed costs, because you owe those before you sell anything, and climbs at your variable cost per unit. It is always above the fixed cost line.
The fixed cost line
Flat, all the way across. That flatness is the entire problem break-even analysis exists to solve.
The crossing point
Where revenue meets total cost. Left of it is the shaded loss wedge, right of it is profit, and the gap widens at the contribution margin per unit.
The gap between the two cost lines is the thing worth studying. A business with high fixed costs and low variable costs has a total cost line that is nearly flat and sits high, so it breaks even late and then makes money fast. A business with low fixed costs and high variable costs breaks even early and then climbs slowly. Neither shape is wrong, but they need completely different amounts of cash to survive.
What break-even analysis cannot tell you
Break-even analysis is a model, and models earn their usefulness by leaving things out. Here is what this one leaves out.
It assumes costs stay linear
Real variable costs fall with volume through bulk pricing, and real fixed costs jump in steps when you need a second oven or a second warehouse.
It assumes the price holds
Selling twice as much often means discounting to do it. The model assumes every unit sells at the same price, which is rarely true at scale.
It says nothing about timing
Breaking even on paper in month three does not mean you have cash in month three. Invoices get paid late and stock gets bought early.
It ignores demand entirely
The calculator will happily tell you that you need 40,000 units. It has no idea whether 40,000 people want what you sell.
It is before tax and before financing
Break-even here means operating break-even. Loan principal, tax and owner drawings all sit outside it and all need paying.
One period, one snapshot
The answer describes the period you entered. Seasonal businesses need this run several times rather than once on an annual average.
Break-even calculator FAQ
What is the break-even point?
The break-even point is the sales volume at which total revenue exactly equals total costs, so you make neither a profit nor a loss. It is expressed either in units sold or in revenue. Below it you are losing money, above it every additional sale adds its contribution margin straight to profit.
What is the break-even point formula?
The break even point formula is fixed costs divided by contribution margin, where contribution margin is the selling price per unit minus the variable cost per unit. For revenue instead of units, divide fixed costs by the contribution margin ratio. With $10,000 of fixed costs, a $50 price and a $30 variable cost, break-even is 500 units or $25,000.
How do I calculate the break-even point?
To find break even point in units, add up every fixed cost for one period, work out your variable cost for one unit, subtract that from your selling price to get the contribution margin, then divide fixed costs by it and round up. The break-even calculator on this page does the arithmetic and also shows the result in revenue, on a chart, and against a target profit.
What is contribution margin?
Contribution margin is what one sale leaves behind after its own variable costs, available to pay down fixed costs. Price minus variable cost per unit. It is not gross profit margin, which includes some fixed costs, and using gross margin in the break even equation gives a materially wrong answer.
What is a good break-even point?
There is no universal figure, because it depends entirely on your cost structure and your market. The useful test is whether the break-even volume is comfortably below what you can realistically sell. Translate it into something concrete, such as customers per day, and ask whether that is achievable. Margin of safety is the better metric once you have real sales.
What if my variable cost is higher than my selling price?
Then there is no break-even point at any volume, because every sale loses money and selling more makes the loss bigger. This calculator tells you so instead of printing a meaningless number. The fix is to raise the price or cut the variable cost per unit. Volume cannot rescue a negative contribution margin.
How do I calculate break-even with a target profit?
Add the profit you want to your fixed costs, then divide by the contribution margin. Treating profit as a cost you must cover is the standard approach. On the running example, $10,000 of fixed costs plus a $5,000 target divided by a $20 contribution margin gives 750 units.
What is margin of safety?
Margin of safety is how far sales can fall before you hit break-even, in currency or as a percentage of current sales. Actual sales minus break-even sales, divided by actual sales. At 800 units against a 500 unit break-even, the margin of safety is 37.5%, meaning sales could drop by more than a third before you start losing money.
How do I do break-even analysis for multiple products?
Use the weighted average contribution margin across your sales mix, then divide fixed costs by it. The multi-product section of this break-even calculator does that and splits the result across each product by its share of the mix. Recalculate whenever the mix changes noticeably, because a shift in what customers buy moves your break-even point without any price changing.
Does a price cut really move break-even that much?
Yes, and it is the most underestimated number in small business planning. A price cut hits the contribution margin, not the revenue line. On the running example a 10% discount raises the break-even point by 33%, so you need a third more customers simply to stand still. The sensitivity table above shows the full range.
Does this break-even calculator work in any currency?
Yes. Pick your currency symbol at the top and every result is labelled in it, or choose no symbol if you prefer plain numbers. The maths is currency neutral, since break-even analysis is a ratio between costs and price rather than anything that depends on a specific currency.
How accurate is break-even analysis?
The arithmetic is exact. The model is not, because it assumes your price, your variable cost per unit and your fixed costs all stay constant across the volume you are modelling. Real costs step up, real prices get discounted, and real demand is finite. Treat break-even as a planning benchmark and rerun it whenever a cost or a price moves.
Sources and limits
The break-even, contribution margin, margin of safety and operating leverage formulas follow OpenStax Principles of Managerial Accounting, chapter 3, including its definitions of margin of safety and degree of operating leverage. The multi-product method uses the weighted average contribution margin as defined by AccountingTools. The US Small Business Administration covers the same calculation from a planning perspective.
Everything here is arithmetic on the figures you enter, not accounting or financial advice specific to your business. Break-even analysis assumes linear costs and a constant price, which no real business has for long. For decisions with real money attached, check the numbers with your accountant. See our calculator accuracy policy for how these formulas were verified.

Written & verified by
B.Tech Computer Science · 8 years in web development & SEO · Bhilwara, India
About ·
LinkedIn ·
Report an error