
Male Delusion Calculator
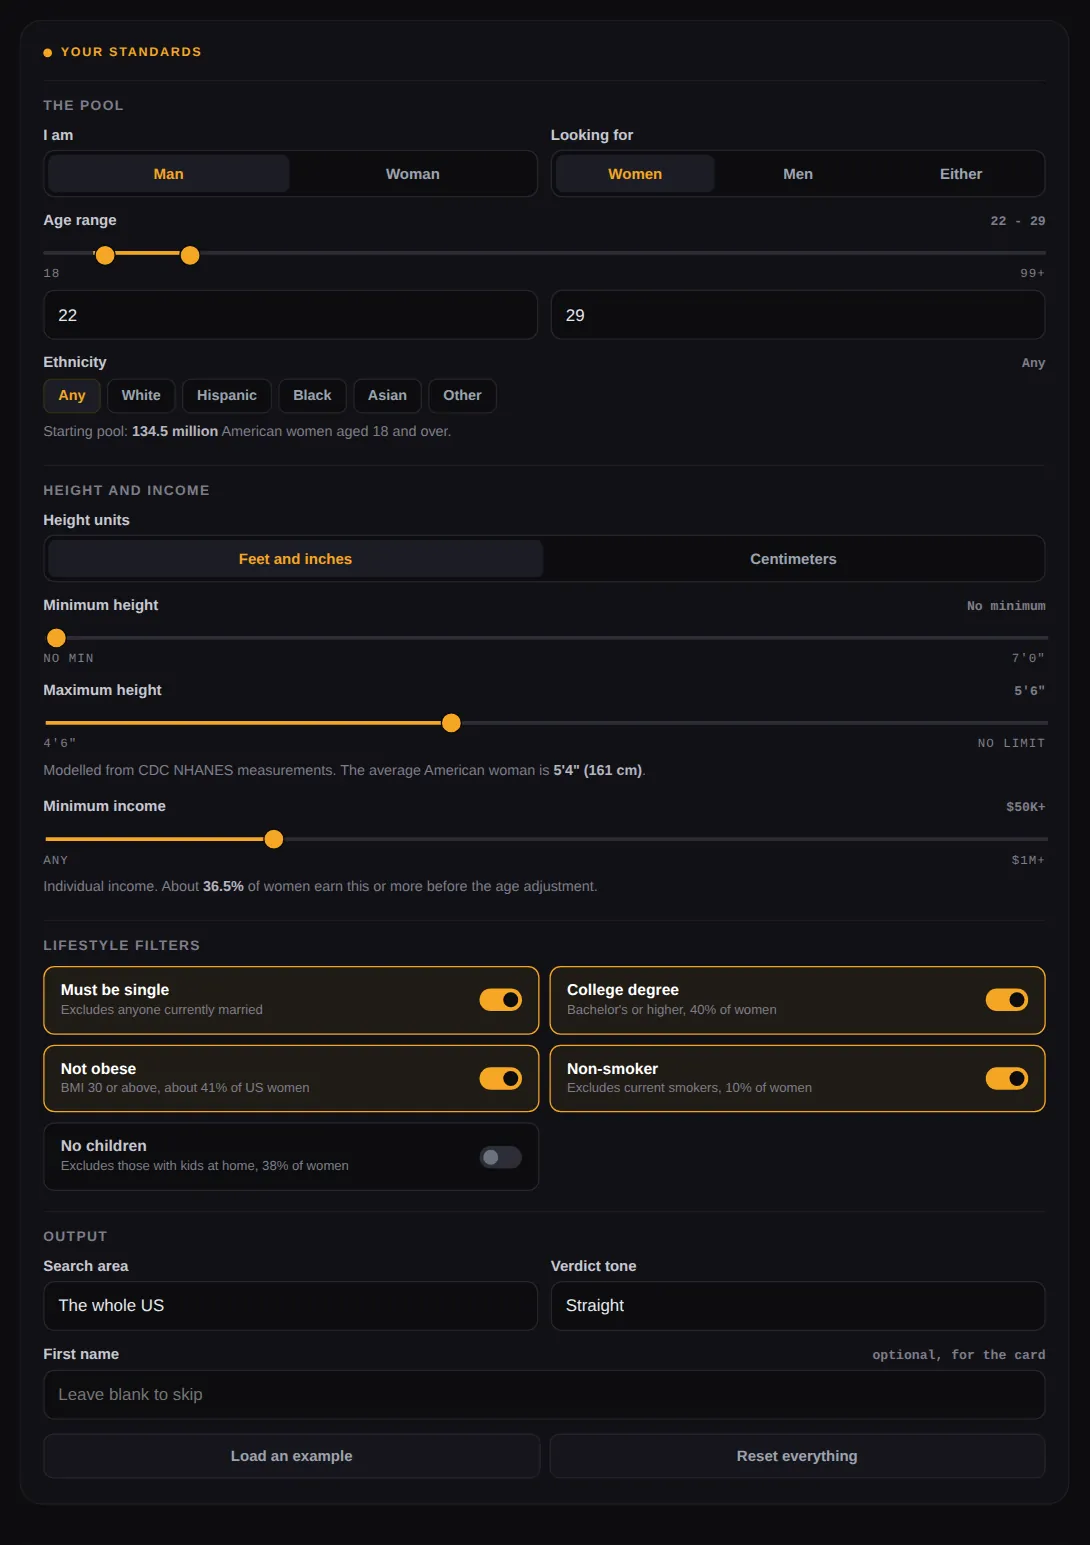
Set the standards you actually hold and see what share of American women clear all of them at once. The numbers come from Census population tables and CDC body measurements, and they move the moment you touch a slider.
The same maths pointed the other way. Enter your own age, height and income to see how rare you are, and whether you would clear the bar you just set.
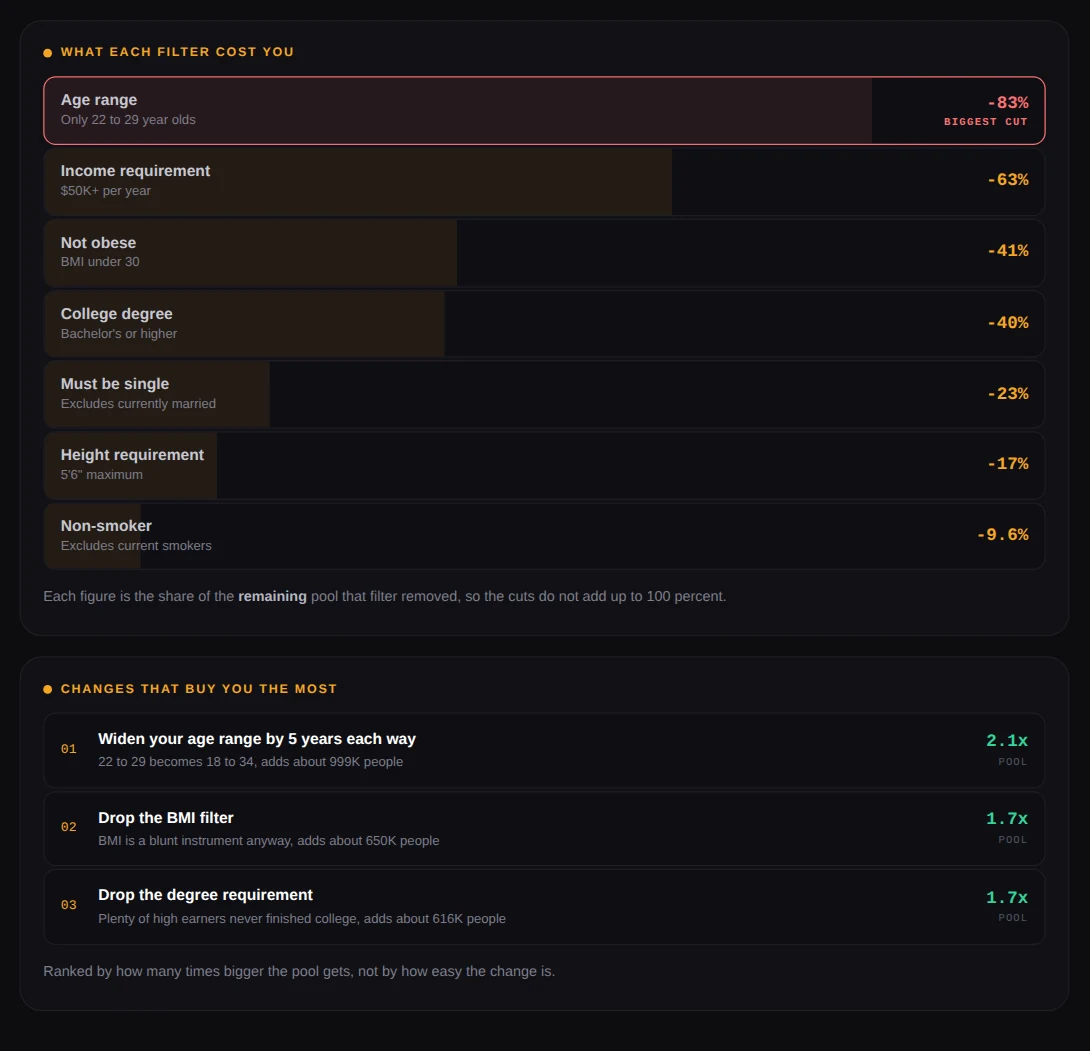
Each figure is the share of the remaining pool that filter removed, so the cuts do not add up to 100 percent.
Ranked by how many times bigger the pool gets, not by how easy the change is.
| Standard | Your setting |
|---|
Want this breakdown in your inbox?
Optional. Your numbers are already on screen, this only mails you a copy you can come back to.
Sources: US Census Bureau American Community Survey and Current Population Survey · CDC NHANES body measurements · Population modelling, not a dating service · Nothing you type leaves your browser unless you enter an email
How the male delusion calculator works
You set the standards you hold for a partner. The calculator applies them to the actual adult population of the United States and tells you how many women are left. Not an opinion, not a vibe check, just the arithmetic of filters applied one after another to census numbers.
Set who you are looking for
Age range, and ethnicity if that matters to you. The starting pool is 134.5 million American women aged 18 and over.
Add the physical and financial filters
Height, either a floor or a ceiling, minimum income, and body type. Each one is applied to the group left over from the previous one.
Read what it cost you
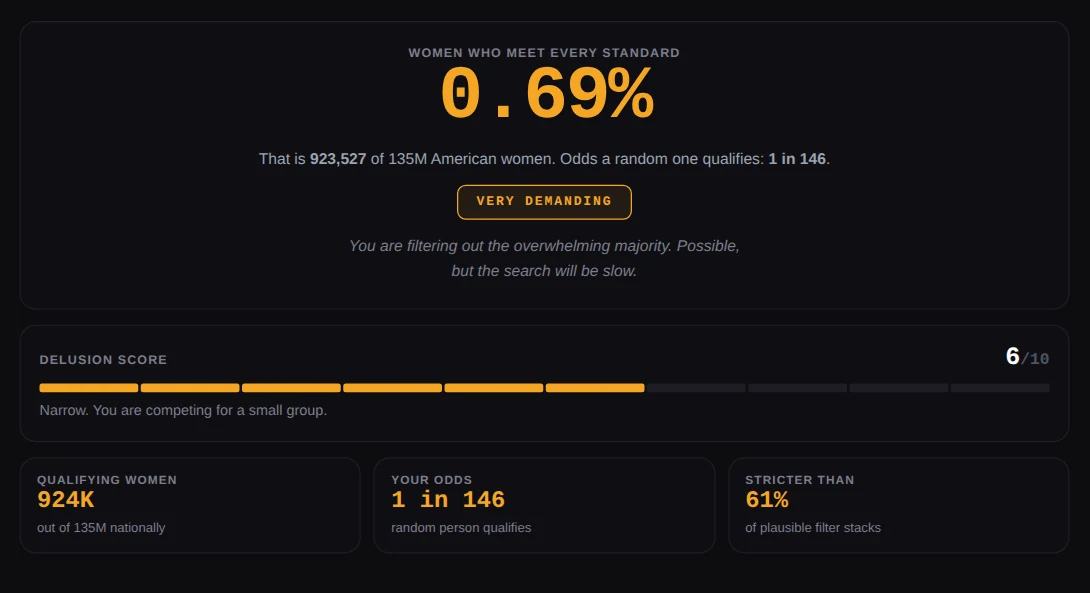
You get the match percentage, the headcount, a ranked list of which requirement removed the most people, and the three changes that would grow your pool the fastest.
Nothing is hidden behind a form
Every number updates live as you move a slider. There is no calculate button, no loading screen and no email wall between you and the result. The email box near the bottom exists only if you want a copy mailed to you.
The reverse check
Under the inputs there is a second box that runs the same maths on you. Enter your own age, height and income and it reports how rare that combination is, then tells you whether you would clear the bars you just set. Height is only turned around on you when you are filtering your own sex, because men and women sit on different height curves and comparing across them proves nothing.
What percentage of women meet your standards?
It collapses faster than almost anyone expects, because filters multiply rather than add. Here is a single set of standards built up one requirement at a time, starting from 134.5 million American women.
| Standard added | Women left | Percentage |
|---|---|---|
| Aged 25 to 35 | 25,824,000 | 19.2% |
| and single | 15,023,650 | 11.2% |
| and no children at home | 9,314,663 | 6.9% |
| and has a college degree | 3,735,180 | 2.8% |
| and earns $50,000 or more | 1,941,634 | 1.4% |
| and BMI under 30 | 1,139,739 | 0.85% |
Six requirements, none of which sounds unreasonable on its own, and the pool has gone from 134.5 million to just over a million. That is the whole point of the exercise. Nobody sets out to be unrealistic. It happens one reasonable-sounding filter at a time.
Which filter costs you the most, and it is not height
This is where the male version diverges sharply from the female one, and it is the most useful thing on this page.
Start from a fixed base of women aged 25 to 35 who are single, which is 11.2 percent of the adult female population. Now add one single requirement and see what it removes:
| Single requirement added | Pool removed | You are left with |
|---|---|---|
| Earns $100,000 or more | 90% | 1.15% |
| At least 5 ft 6 in tall | 83% | 1.93% |
| Earns $50,000 or more | 65% | 3.88% |
| Has a college degree | 60% | 4.48% |
| BMI under 30 | 41% | 6.56% |
| 5 ft 4 in or shorter | 41% | 6.64% |
| No children at home | 38% | 6.93% |
| 5 ft 6 in or shorter | 17% | 9.24% |
| Non-smoker | 10% | 10.10% |
| 5 ft 8 in or shorter | 5% | 10.61% |
Why a height ceiling is almost free for men
The average American woman is about 5 ft 4 in. If you say you want someone 5 ft 8 in or shorter, you have excluded about five percent of women, because most of them were already under that line. A height ceiling barely registers.
Flip it and the number explodes. Asking for a woman who is at least 5 ft 6 in removes 83 percent of the pool, because you have moved to the thin end of the distribution rather than the fat middle.
Income and education are the expensive ones
A $50,000 minimum removes about 65 percent of women aged 25 to 35. Push it to $100,000 and you remove 90 percent. A degree requirement removes about 60 percent. These are the filters actually destroying most men's numbers, and they are usually the ones nobody thinks twice about ticking.
Compare that with the female delusion calculator, where a 6 ft height minimum is the single most destructive filter because only a small share of men clear it. Same tool, same maths, opposite pressure point. Height is the wall for women, income is the wall for men.
Where the numbers come from
Every figure traces back to two public datasets. Nothing here is invented, and nothing is scraped from dating apps.
- US Census Bureau, American Community Survey. Population by age and sex, marital status, individual earnings, educational attainment, and presence of children in the household.
- CDC, National Health and Nutrition Examination Survey. Measured adult height and body mass index, plus smoking prevalence.
How the filters are combined
Height is modelled as a normal distribution fitted to the NHANES measurements for adult women, mean about 161 cm with a standard deviation of about 7 cm, rather than a lookup table with gaps in it. That is why moving the slider an inch changes the answer smoothly instead of jumping.
Two of the filters are handled conditionally rather than multiplied blindly, because the underlying traits are correlated:
- Marital status depends on age. Around 70 percent of women aged 25 to 29 are unmarried, against roughly 40 percent of women in their late thirties. The calculator uses the rate for the age range you actually selected, not one national average.
- Education depends on income. If you have already asked for $100,000 a year, most of the women left hold a degree, so adding a degree requirement costs far less than it would on its own. Multiplying the two independently would overstate the damage badly.
- Income depends on age. Earnings peak in midlife, so the income filter is adjusted for the age band you chose.
Ethnicity works the other way round. Selecting more than one group makes the pool bigger, because those shares add together.
How to read your delusion score
The score is a one to ten compression of your match rate. Each verdict band owns two points on the scale, and your position inside the band is set on a logarithmic curve, because the interesting range runs from tens of percent down to thousandths of a percent and a linear scale would flatten all of it. The score and the verdict can never disagree with each other.
| Match rate | Verdict | What it means in practice |
|---|---|---|
| 15% and up | Grounded | Millions qualify. You could meet someone in an ordinary week. |
| 3% to 15% | Selective | Narrowed but workable. A large city still holds thousands of matches. |
| 0.3% to 3% | Very demanding | You have excluded the large majority. The search gets slow. |
| 0.02% to 0.3% | Statistically brutal | They exist, but finding one is the hard part. |
| Under 0.02% | Mythical | You are describing an outlier, not a person you are likely to meet. |
The score is not a judgement of you. It is a measure of how far into the tail of the distribution your filter stack reaches. Someone with a 2 percent match rate in a big city has more real options than someone with 8 percent in a small town.
Male delusion calculator vs female delusion calculator
Same engine, same datasets, opposite direction. The male version filters the female population against a man's standards. The female delusion calculator filters the male population against a woman's standards. Both live on this site and both use the same census and CDC figures.
| Male delusion calculator | Female delusion calculator | |
|---|---|---|
| Pool being filtered | 134.5 million women | 127.5 million men |
| Most expensive filter | Income, then education | Height, by a wide margin |
| Height ceiling costs | About 5% at 5 ft 8 in | Rarely used |
| Height floor costs | 83% at 5 ft 6 in | About 85% at 6 ft |
| Typical blind spot | Stacking income and degree together | Treating 6 ft as a baseline |
If you want to compare the two honestly, run the same filter stack on both pages and look at where the biggest cut lands. That contrast is more interesting than either number on its own.
What this calculator gets wrong
Worth saying plainly, because none of the competing tools will.
It only counts availability, not interest
Every number here answers one question: how many women match the description. It says nothing about how many of them would be interested in you, which is the half of the equation that actually decides outcomes. A 2 percent match rate is not a 2 percent chance of a relationship.
The filters are independent apart from three
Age, income and education are handled conditionally. The rest are multiplied as though they were unrelated, and in reality traits correlate in ways no public dataset captures cleanly. Treat very small percentages as directional rather than exact.
It is United States data
Census ACS and CDC NHANES cover the US population. Run it from another country and the shape of the answer holds, the absolute numbers do not.
Height and BMI are blunt
BMI does not distinguish between body types, and the height model assumes a smooth distribution. Both are good enough for the scale of estimate this tool makes and neither is good enough to describe a person.
This is a statistics toy, not advice. It measures how rare a description is, which is a different thing from whether a description is reasonable, and a very different thing from whether you will be happy with the person you eventually meet. Nobody chooses a partner off a spreadsheet.
Related calculators and reading
Female Delusion Calculator
The same engine pointed the other way, filtering the male population against a woman's standards.
Delusion calculator guides
Articles on the data behind these tools, how the filters interact and what the numbers do and do not mean.
Health & Fitness calculators
BMI, water intake, heart rate zones, running pace and sleep cycles.
All Calcxi calculators
Every category in one place, from finance and business to construction and mathematics.
Male delusion calculator FAQs
What is the male delusion calculator?
It is a tool that takes the standards a man holds for a partner, applies them to US Census and CDC population data, and reports what percentage of American women meet all of them at once. It measures how rare a description is, nothing more.
What percentage of women meet my standards?
It depends entirely on which filters you stack. Women aged 25 to 35 are 19.2 percent of the adult female population. Add single and it falls to 11.2 percent. Add no children, a degree and a $50,000 income and you are at 1.4 percent, which is about 1.9 million women out of 134.5 million.
Which filter reduces the dating pool the most?
Income, then education. Starting from single women aged 25 to 35, a $100,000 minimum removes 90 percent of the pool and a $50,000 minimum removes 65 percent. A degree requirement removes about 60 percent. Height ceilings, which men set far more often, remove very little by comparison.
Why does my height requirement barely change the result?
Because you are almost certainly setting a ceiling rather than a floor. The average American woman is around 5 ft 4 in, so asking for 5 ft 8 in or shorter excludes only about five percent. Ask for a woman who is at least 5 ft 6 in and the same filter removes 83 percent, because that is the thin end of the distribution.
What data does the male delusion calculator use?
Two public sources. The US Census Bureau's American Community Survey supplies population by age and sex, marital status, individual earnings, education and children in the household. The CDC's NHANES supplies measured height, body mass index and smoking prevalence.
Is the male delusion calculator accurate?
The population figures are real and the arithmetic is exact. The modelling is an estimate: height is fitted to a normal distribution, and while age, income and education are handled conditionally, the remaining filters are treated as independent when in reality traits correlate. Read large percentages as solid and very small ones as directional.
Does it account for who would actually be interested in me?
No, and that is the biggest limitation. It counts how many women match your description. It cannot count how many of those would want to date you, which is the other half of the problem and the half that decides what actually happens.
What is a good delusion score?
Anything at four or below means millions of people clear your bar. Five and six mean you have narrowed things considerably but a large city still holds plenty of matches. Seven and above means you are in the tail of the distribution and should expect a long search.
How is this different from the female delusion calculator?
The engine and the data are identical, the direction is reversed. The male version filters 134.5 million women against a man's standards. The female version filters 127.5 million men against a woman's. The interesting difference is where the damage comes from: income for men filtering women, height for women filtering men.
What does "must be single" exclude?
Currently married women. The rate depends heavily on age, which is why the calculator uses the figure for the age range you picked rather than one national number. Around 70 percent of women aged 25 to 29 are unmarried, against roughly 40 percent in their late thirties.
Does the calculator store my answers?
The calculation runs in your browser and nothing is gated. There is an optional email box if you want a copy of the breakdown mailed to you, and only then are your email and filter settings recorded so the mail can be sent.
Is the male delusion calculator free?
Yes. No account, no payment, no limit on how many times you run it. Change one filter and run it again to see exactly what that filter was costing you.
Can I use it outside the United States?
You can run it anywhere, but the population data is American. The relative picture still holds, since income and education filters are expensive almost everywhere and height ceilings are cheap almost everywhere. The absolute headcounts will not match your country.
Is this meant to be taken seriously?
Half seriously. The data is real and the point it makes is real: filters multiply, and six reasonable requirements can leave you with less than one percent of the population. What it cannot tell you is whether any particular standard is worth keeping. That part is yours.

Written & verified by
B.Tech Computer Science · 8 years in web development & SEO · Bhilwara, India
About ·
LinkedIn ·
Report an error