
Key takeaways
- In 2025, 176 US common stock issues cut or suspended their dividend. In 2024 it was 132, the quietest year in a decade.
- Across every year S&P has published since 2009, the count has never dropped below 101. There is no year with zero.
- 2016 is the year to look at: 659 cuts, the third highest count in the series, in a year with no recession and a rising net dividend.
- In dollars, 2025 cuts of $12.9 billion offset 21.8% of the $59.3 billion of increases. In 2024 it was 25.4%.
- These counts cover all US domestic common stocks, not the S&P 500. Mixing the two is the most common mistake in articles on this topic.
Most dividend projections are built on a single growth rate applied in a straight line for thirty years. The line never dips. That is not how the data behaves, and S&P Dow Jones Indices has been publishing the evidence quarterly for years without many people reading it.
How many companies cut their dividend each year?
S&P publishes a count every quarter and a summary every January. For 2025, the January 2026 release states that “176 issues decreased their dividend payments, a 33.3% increase compared to the 132 decreases for 2024.” Against that, 2,293 issues increased their payments, down from 2,450 in 2024.
S&P defines a decrease as “either a decrease or suspension in dividend payments”, so a company that stops paying entirely is counted in the same bucket as one that trims by a cent.
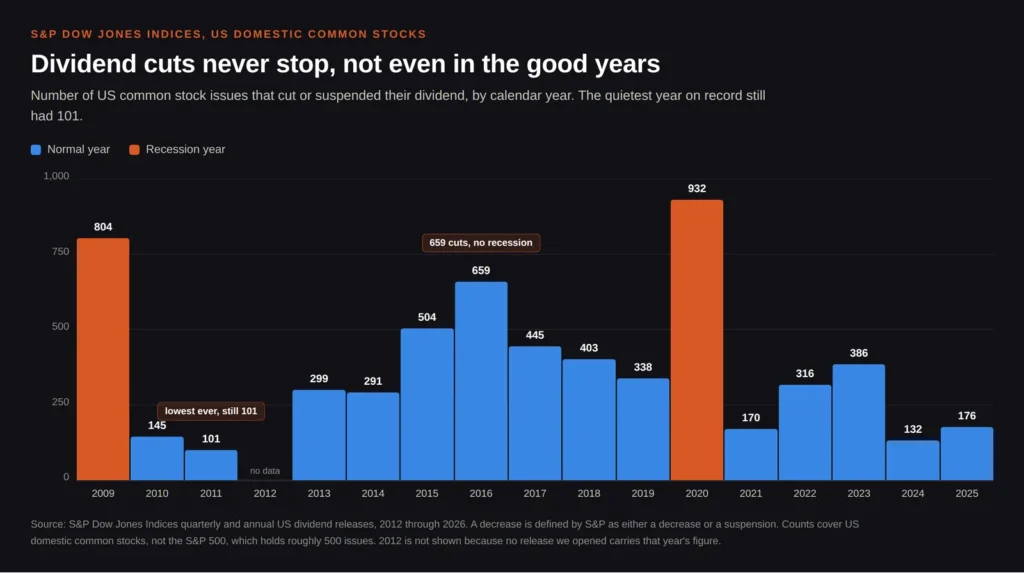
The shape of that chart is the whole argument. Two bars tower over the rest, 2009 and 2020, and they are the two years everybody already knows about. The interesting part is what happens in between: the line never comes down to zero, and in several ordinary years it climbs most of the way back up.
The year nobody mentions: 2016
659 US issues cut or suspended their dividend in 2016. That is more than three times the 2025 count and more than four times 2024. It is the third highest figure in the whole series, behind only the two crisis years.
2016 was not a recession. The net indicated dividend change for the year was still positive at $23.6 billion. The S&P 500 ended the year up. If you had been projecting dividend income at the start of 2016 using a flat growth rate, nothing in the headline numbers would have warned you, and 659 companies would still have cut.
The same pattern shows up in 2015 (504 cuts) and 2023 (386 cuts). Both were years when the aggregate dividend rose and the market did fine.
The reason is simple once you see it: these counts cover thousands of companies across every sector. Aggregate dividends can rise comfortably while a few hundred individual companies are having a bad year. Energy drove the 2015 and 2016 numbers. The aggregate hides it. Your individual holding does not.
What cuts cost in dollars, not just in counts
Counts tell you how often. Dollars tell you how much, and the dollar figures are the ones that should change how you project.
| Year | Issues that raised | Issues that cut | Cuts per 100 raises | Note |
|---|---|---|---|---|
| 2015 | 2,810 | 504 | 17.9 | |
| 2016 | 2,634 | 659 | 25.0 | No recession. Net dividend still rose $23.6B. |
| 2017 | 2,642 | 445 | 16.8 | |
| 2018 | 2,768 | 403 | 14.6 | |
| 2019 | 2,381 | 338 | 14.2 | |
| 2020 | 1,901 | 932 | 49.0 | Pandemic. 43 S&P 500 issues suspended. |
| 2021 | 2,910 | 170 | 5.8 | Rebound year. |
| 2022 | 2,827 | 316 | 11.2 | |
| 2023 | 2,548 | 386 | 15.1 | |
| 2024 | 2,450 | 132 | 5.4 | Quietest year in the series since 2011. |
| 2025 | 2,293 | 176 | 7.7 | Cuts rose 33.3% on 2024. |
S&P Dow Jones Indices, US domestic common stocks, from the January release of each following year. A decrease is defined by S&P as either a decrease or a suspension. The ratio column is our own arithmetic. Excluding 2009 and 2020, the ratio has run from 5.2 to 25.0 cuts per 100 raises, with a median of 11.2.
In 2025, S&P recorded $59.3 billion of dividend increases and $12.9 billion of decreases, for a net gain of $46.4 billion. The cuts gave back 21.8% of what the increases added. In 2024 the figure was 25.4%, on $71.4 billion of increases against $18.1 billion of cuts.
Both of those were good years. Neither had a recession, a credit event or an energy collapse. And in both, roughly a fifth to a quarter of the gross dividend growth was cancelled out by companies going the other way.
A projection that applies a growth rate to your income and never subtracts anything is implicitly assuming that number is zero. On the last two years of data, that assumption runs about a fifth high at the aggregate level.
The mistake almost every article makes
This part matters if you go reading other sources on this topic, because the numbers get quoted wildly out of context.
S&P’s cut counts are not S&P 500 counts. The releases describe them as covering “U.S. domestic common stocks”, a universe S&P has previously described as roughly 7,000 companies. The S&P 500 holds about 500 issues. So when a page tells you 176 companies cut their dividend and then frames it as a share of the S&P 500, the maths is out by more than a factor of ten.
We found pages claiming “2 to 4% of S&P 500 dividend payers cut in a typical year” and “about 20% cut in 2008 to 2009 and during 2020”, with no source attached to either figure. The second one does not match what S&P publishes.
Here is what S&P does say about the S&P 500 specifically: 43 S&P 500 issues suspended their dividends in 2020. On an index of roughly 505 issues, that is about 8.5%, and that is suspensions, not all cuts.
One more trap. The figure of $40.8 billion often appears attached to those 43 suspensions, as if it were their value. It is not. S&P’s January 2022 release makes clear that $40.8 billion was the net indicated dividend change for 2020 across the whole universe. Gross decreases in 2020 were far larger, at $82.2 billion.
What 2020 did that has not been undone
There is one long shadow in this data that gets very little attention.
At the end of 2019, 423 S&P 500 issues paid a dividend, or 83.8% of the index. In 2020 that fell to 385 issues, 76.2%. By the end of 2025, it had recovered to 409 issues, or 81.3%.
Six years on, the index still has 14 fewer dividend payers than it did before 2020, and the payer share is still 2.5 points below where it started. The aggregate dividend recovered quickly and then set records. The number of companies willing to pay one did not fully recover.
That is a slower, quieter risk than a cut. A company that stops paying and never restarts does not show up in next year’s cut count at all. It simply leaves the pool.
What to do with this when you project income
None of this is an argument against dividend investing. It is an argument against one specific habit: taking a growth rate, applying it in a straight line, and reading the final number as a plan.
Three practical adjustments follow from the data above.
Model a range, not a number. Run your projection at your expected growth rate, then run it again a few points lower. The gap between the two is the honest answer. If the plan only works at the top of the range, it is not a plan.
Apply a haircut to gross growth. On the last two years, aggregate cuts offset about a fifth to a quarter of aggregate increases. If you are projecting from a broad market dividend growth figure, that figure is already net. If you are projecting from your own holdings’ recent raises, it is not, and some allowance belongs there.
Concentration is where this bites. These are aggregate numbers across thousands of companies. If you hold forty positions, one cut moves your income a little. If you hold six, one cut moves it a lot, and the 2016 pattern says a cut can arrive in a year when nothing looks wrong.
Our dividend calculator is built around that first point. It gives a range rather than a single projection, applies dividend tax properly rather than ignoring it, and shows the year your income covers a bill in today’s money rather than in nominal dollars thirty years out.
Free tool
Dividend Calculator
Project your dividend income as a range rather than one optimistic line, with dividend tax applied properly and the result shown in today's money.
How often do companies cut dividends: FAQs
How often do companies cut dividends?
Every year, without exception in the published data. Between 2009 and 2025, the annual count of US common stock issues cutting or suspending ranged from 101 in 2011 to 932 in 2020. In 2025 it was 176.
What percentage of companies cut their dividend?
S&P does not publish a total universe size for recent years, so a clean percentage cannot be built from its releases. What can be said: in 2025, 176 issues cut against 2,293 that increased, so cuts were about 7% of all issues that changed their dividend at all.
Do dividend cuts only happen in recessions?
No, and 2016 is the clearest counterexample. 659 issues cut that year with no recession and a net dividend gain of $23.6 billion. 2015 and 2023 show the same pattern at a smaller scale.
How many S&P 500 companies cut their dividend in 2020?
S&P states that 43 S&P 500 issues suspended their dividends in 2020. A mid-year post by S&P’s Howard Silverblatt counted 62 S&P 500 decreases by the end of June 2020, of which 41 were suspensions. A full-year count of all S&P 500 cuts, as opposed to suspensions, is not published in the releases we read.
Is a dividend cut always bad news?
Not always. A company cutting to fund something that earns more than the dividend did is a different event from one cutting because it cannot pay. The count data does not distinguish between them, which is a real limit on everything above.
Which sectors cut most often?
The releases we read give counts and dollars but not a sector split for cuts. The 2015 and 2016 spikes are widely attributed to energy, and the 2020 spike was broad. Treat sector claims elsewhere with care unless they name a source.
Sources
All counts and dollar figures come from S&P Dow Jones Indices quarterly and annual US dividend releases, read directly rather than through secondary coverage. The 2025 and 2024 figures are from the 7 January 2026 release. The 2020 figures, including the $82.2 billion of gross decreases, are from the 6 January 2021 release. The mid-2020 S&P 500 detail is from Howard Silverblatt’s post on S&P’s Indexology blog. Ratios and percentages in this post are our own arithmetic from those published figures.
Figures checked 8 October 2026. S&P publishes an updated release each January, so this post is reviewed annually.

Written & verified by
B.Tech Computer Science · 8 years in web development & SEO · Bhilwara, India
About ·
LinkedIn ·
Report an error