
Key takeaways
- SCHD paid $1.0476 per share in calendar 2025. Over the last four distributions, from December 2025 to September 2026, it paid $1.0541. The latest single payment was $0.2665.
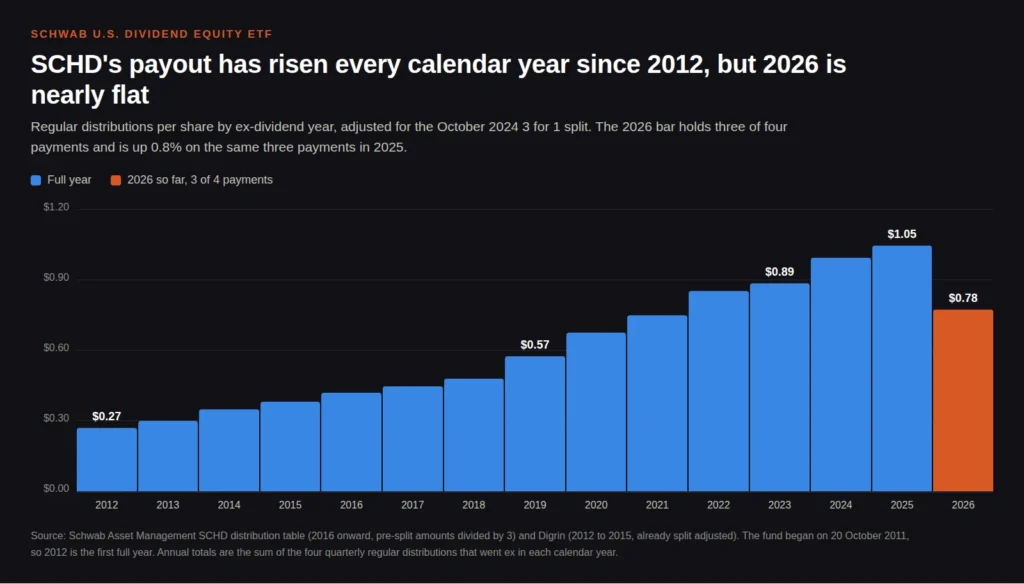
- The yearly total has risen in every calendar year from 2013 to 2025. The 2025 payout is about 3.9 times the 2012 payout.
- The pace is uneven. It ran from 19.8% in 2019 down to 3.8% in 2023, and 2026 is up only 0.8% so far against the same three payments in 2025.
- Quarters are not equal. March was the smallest payment of the year in 12 of the 13 full years from 2013 to 2025, and December the biggest in 8.
- Every figure on this page is adjusted for the October 2024 3 for 1 split. Schwab’s own table is not, which is why older numbers there look three times too big.
Search for SCHD’s dividend history and you get tables that disagree by a factor of three, depending on whether the page adjusted for the 2024 share split. This page uses one consistent basis throughout, shows how to convert Schwab’s raw figures, and spells out what the pattern does and does not say about future payments.
SCHD dividend per share by year
Each total below is the sum of the four regular quarterly distributions that went ex-dividend in that calendar year. The fund began on 20 October 2011, so 2012 is its first full year.
| Year | Dividend per share | Change on prior year | Payments |
|---|---|---|---|
| 2012 | $0.2700 | First full year | 4 |
| 2013 | $0.3013 | +11.6% | 4 |
| 2014 | $0.3490 | +15.8% | 4 |
| 2015 | $0.3822 | +9.5% | 4 |
| 2016 | $0.4194 | +9.7% | 4 |
| 2017 | $0.4486 | +7.0% | 4 |
| 2018 | $0.4798 | +7.0% | 4 |
| 2019 | $0.5747 | +19.8% | 4 |
| 2020 | $0.6761 | +17.6% | 4 |
| 2021 | $0.7497 | +10.9% | 4 |
| 2022 | $0.8538 | +13.9% | 4 |
| 2023 | $0.8860 | +3.8% | 4 |
| 2024 | $0.9944 | +12.2% | 4 |
| 2025 | $1.0476 | +5.4% | 4 |
| 2026 | $0.7759 so far | +0.8% vs the same 3 payments in 2025 | 3 of 4 |
Split adjusted. 2016 onward from Schwab Asset Management’s distribution table (pre-split amounts divided by 3), 2012 to 2015 from Digrin. Yellow rows are years with a change under 6%. The December 2026 payment is not yet declared.
Two things stand out. The total has gone up every single year, which is what dividend growth investors mean when they point at SCHD. And the size of each step has varied a lot, so a single average growth number hides more than it shows.
The last twelve payments, quarter by quarter
The yearly view smooths out something you will notice the moment you compare individual payments. The last twelve quarters show both the split adjustment and the year over year change in each payment.
| Ex-dividend date | Per share, split adjusted | Figure on Schwab’s table | Change on same quarter a year earlier |
|---|---|---|---|
| 23 Sep 2026 | $0.2665 | Same, already post-split | +2.3% |
| 24 Jun 2026 | $0.2525 | Same, already post-split | -3.0% |
| 25 Mar 2026 | $0.2569 | Same, already post-split | +3.3% |
| 10 Dec 2025 | $0.2782 | Same, already post-split | +5.2% |
| 24 Sep 2025 | $0.2604 | Same, already post-split | +3.5% |
| 25 Jun 2025 | $0.2602 | Same, already post-split | -5.3% |
| 26 Mar 2025 | $0.2488 | Same, already post-split | +22.2% |
| 11 Dec 2024 | $0.2645 | Same, already post-split | +6.9% |
| 25 Sep 2024 | $0.2515 | $0.7545 | +15.3% |
| 26 Jun 2024 | $0.2747 | $0.8241 | +24.0% |
| 20 Mar 2024 | $0.2037 | $0.6110 | +2.4% |
| 06 Dec 2023 | $0.2474 | $0.7423 | +5.5% |
Red rows are payments below the same quarter a year earlier. Schwab’s table shows pre-October 2024 payments unadjusted for the 3 for 1 split.
The split trap: why older numbers look three times too big
SCHD did a 3 for 1 share split effective 10 October 2024. Schwab Asset Management’s distribution table does not restate the older payments. It shows $0.7545 for September 2024 and $0.2645 for December 2024, which looks like a collapse when it is nothing of the kind. Divide any ex-date up to 25 September 2024 by three and the two series line up: $0.7545 becomes $0.2515.
Sources handle this differently, which is why the 2023 total can read $0.89 or $2.66 depending on where you look. Both are the same money, counted on a different share base. If you are comparing two sources, check the September 2024 row first. Our SCHD dividend calculator has a pre-split figure converter for exactly this reason.
What the history actually shows
The annual total keeps rising, but not at a steady pace. The change from the year before was 19.8% in 2019 and 17.6% in 2020, then 13.9% in 2022, then just 3.8% in 2023, 12.2% in 2024 and 5.4% in 2025. Anyone projecting future income with one fixed growth rate is smoothing over years that ranged from a gain of one fifth to a gain of a few percent.
2026 is the weakest start since 2016. The three payments so far total $0.7759, against $0.7694 for the same three payments in 2025, a gain of 0.8%. In 2016 the first three payments actually fell 1.8% from a year earlier, and the full year still finished 9.7% higher, so a soft start is not the same as a down year. The June 2026 payment of $0.2525 was 3.0% below June 2025, and June 2025 was itself 5.3% below June 2024. Two June payments in a row came in under the year before, even as the annual totals around them rose.
The four quarters are not equal. March was the smallest payment of the year in 12 of the 13 full years from 2013 to 2025, the one exception being 2016. December was the biggest in 8 of those 13 years. So a quarter of the annual total is a poor estimate of any single payment, and a year of income built from one quarter times four will be wrong by a noticeable margin.
No completed calendar year has paid less than the one before. That is a statement about the annual total of regular distributions, not a promise. Individual payments have fallen below the year earlier, as the June figures show, and a fund that holds companies selected by rule can see its payout change at its annual reconstitution. For how rarely companies hold their payouts steady in practice, see our look at how often companies cut dividends.
Using the history for income planning
For a quick estimate of income from the shares you hold, the most defensible starting number is the last four payments added together, $1.0541 per share at the time of writing. That is what our calculator uses as its trailing twelve month figure. It is a measure of what the fund has paid, not a forecast of what it will pay.
Three habits keep estimates honest. Use the trailing figure rather than an average of past growth. Expect payments to land in March, June, September and December, which our page on when SCHD pays dividends lays out, with the dates that decide who is paid covered in SCHD’s ex-dividend date. And run the numbers as a range, because tax and growth both move the result.
Free tool
SCHD Dividend Calculator
Project SCHD dividend income with DRIP, tax applied properly, and a Roth against a taxable account, shown as a range instead of one optimistic number.
Quick answers
How much dividend does SCHD pay per share?
$1.0476 in calendar 2025 and $1.0541 over the last four distributions through September 2026. The latest single payment, on 23 September 2026, was $0.2665.
How much did SCHD pay in dividends each year?
From 2012 to 2025 the yearly total rose from $0.27 to $1.05 per share, adjusted for the 2024 split. The full year by year table is above.
Has SCHD ever cut its dividend?
Not on an annual basis. Each calendar year from 2013 to 2025 paid more than the one before. Individual quarterly payments have come in below the same quarter a year earlier, as in June 2025 and June 2026.
Are SCHD's historical dividends adjusted for the stock split?
It depends on the source. Schwab’s table shows pre-October 2024 payments unadjusted, so divide them by three. The figures on this page are all adjusted.
Which quarter pays SCHD's biggest dividend?
Most often December, which was the largest payment in 8 of the 13 full years from 2013 to 2025. March was the smallest in 12 of 13.
When did SCHD start paying dividends?
The fund began on 20 October 2011, so 2012 was its first full year of payments.
Is SCHD's dividend growing in 2026?
Barely so far. The three payments to date total $0.7759, up 0.8% on the same three payments in 2025, with the December payment still to come.

Written & verified by
B.Tech Computer Science · 8 years in web development & SEO · Bhilwara, India
About ·
LinkedIn ·
Report an error