
SCHD Dividend Calculator
Project a Schwab U.S. Dividend Equity ETF position with dividends reinvested. This SCHD calculator models the expense ratio, applies dividend tax in a taxable account, runs a Roth comparison side by side, and shows a range instead of one false-precision number.
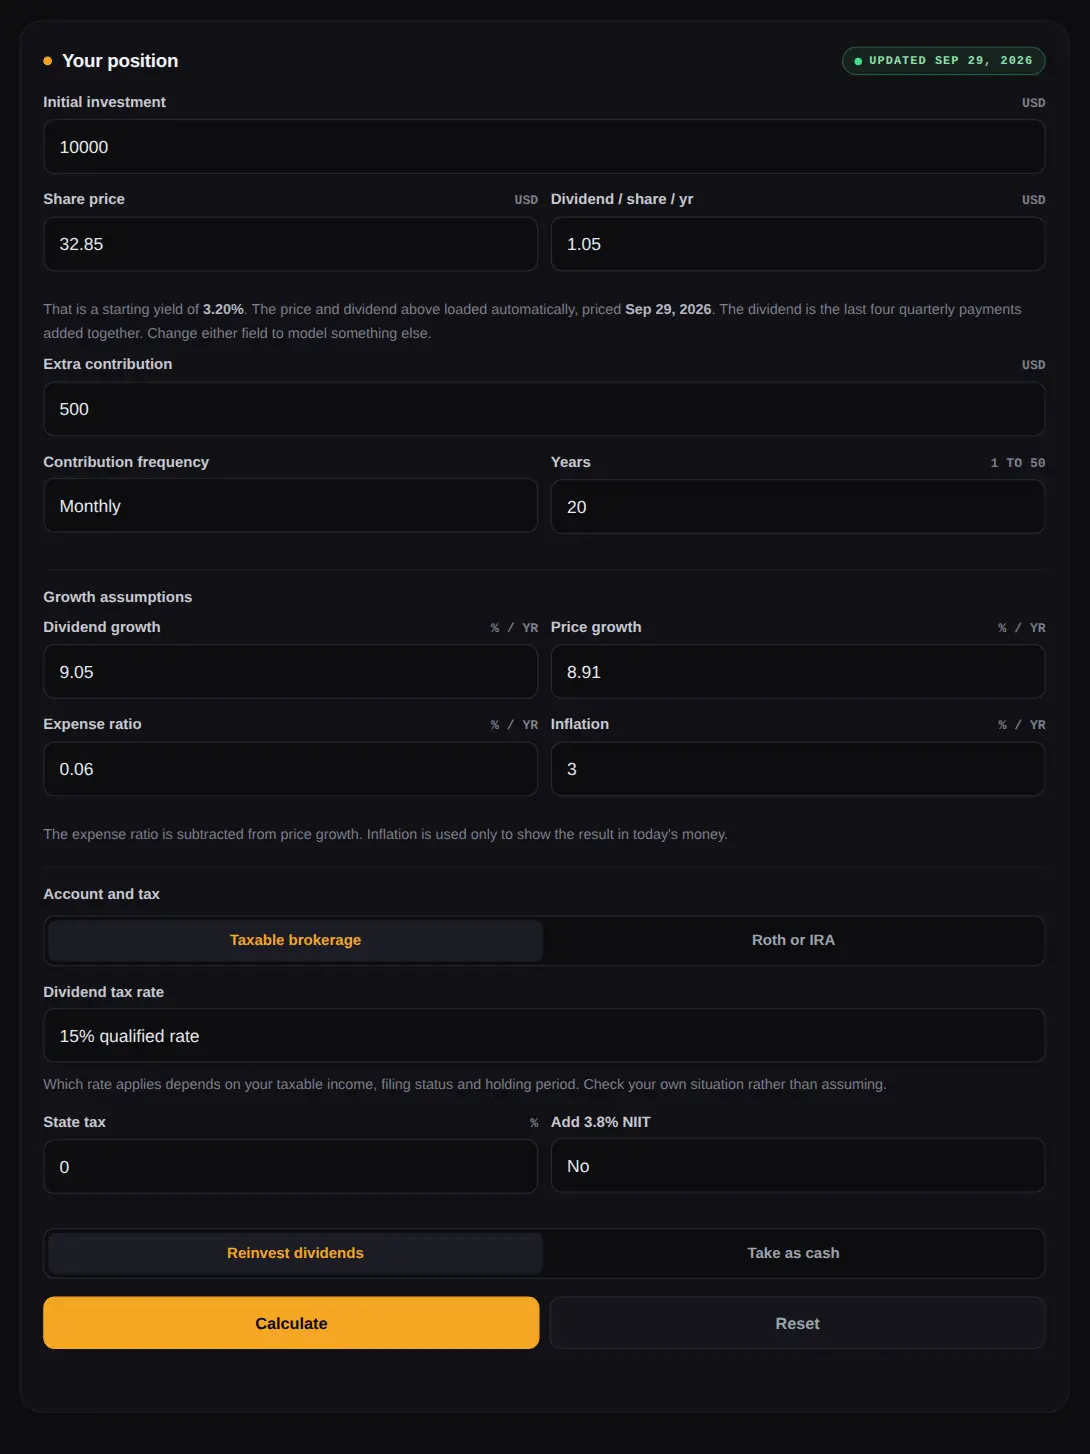
Your position
Loading priceThe expense ratio is subtracted from price growth. Inflation is used only to show the result in today's money.
Which rate applies depends on your taxable income, filing status and holding period. Check your own situation rather than assuming.
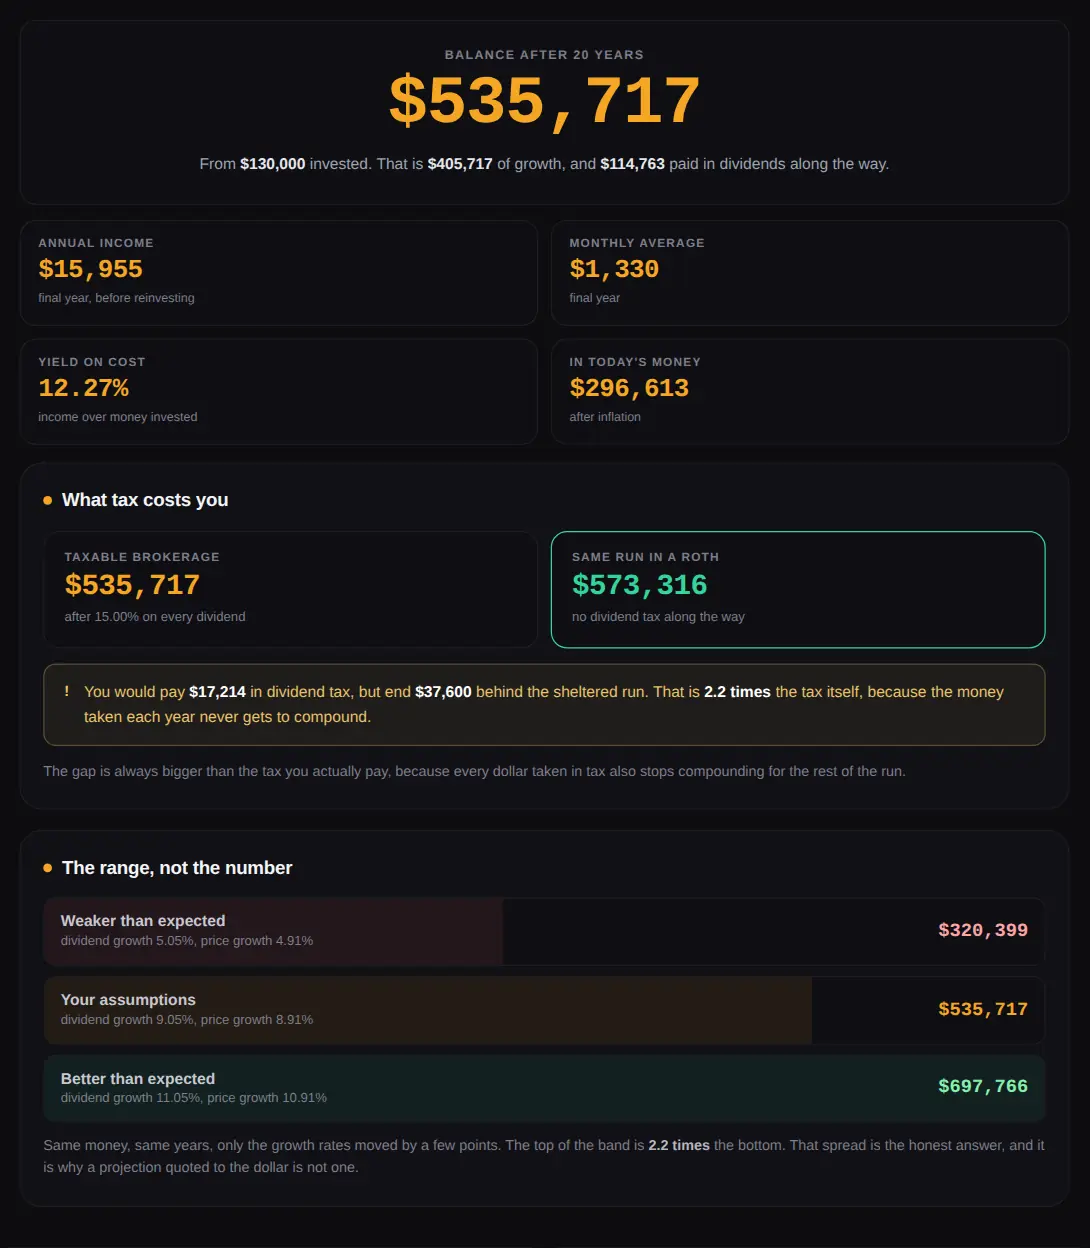
What tax costs you
The gap is always bigger than the tax you actually pay, because every dollar taken in tax also stops compounding for the rest of the run.
The range, not the number
Year by year
| Year | Shares | Price | Div / share | Dividends | Tax | Yield on cost | Balance |
|---|---|---|---|---|---|---|---|
| Press Calculate to build the table. | |||||||
Pre-split figure converter
SCHD split 3 for 1 in October 2024. Old notes, screenshots and cost basis records from before that date use share prices roughly three times today's. Paste an old number here to convert it.
Enter a pre-split figure above.
Runs entirely in your browser · Nothing you enter is sent anywhere · Not investment, tax or financial advice · Past performance is no guarantee of future results
What This SCHD Dividend Calculator Does
This SCHD dividend calculator projects a position in the Schwab U.S. Dividend Equity ETF forward, reinvesting each distribution to buy more shares, which then pay their own dividends. That loop is what people mean by the dividend snowball, and it is what a dividend reinvestment calculator is really measuring.
Three things here are not in the other SCHD calculator pages, and all three change the answer rather than decorating it. The expense ratio is actually subtracted from growth instead of being displayed as trivia. Dividend tax is applied year by year in a taxable account, with the same run shown beside a Roth. And the result comes as a range, because a single figure quoted to the dollar twenty years out is not a projection, it is a guess wearing a suit.
How to Use the SCHD Calculator
- Enter what you are starting with. The share price and annual dividend fill in on their own, so you can leave them alone unless you want to model a different entry point.
- Add anything you plan to contribute, and how often.
- Set your growth assumptions. Past rates are a starting point, not a prediction.
- Choose the account. A taxable brokerage applies dividend tax each year, a Roth or IRA does not.
- Read the range as well as the headline number, and check the year by year table to see where the income actually arrives.
Where the price and dividend come from
The share price and the annual dividend load by themselves when the page opens, and the small label beside Your position shows the date the price is from. The dividend figure is SCHD's last four quarterly payments added together, which is the trailing twelve month number, not a forecast of the next four.
If the feed is slow or unavailable, the calculator keeps working with the last figures it knows and says so rather than pretending. Either way you can type over both fields, because plenty of people want to model the price they actually paid rather than today's. Everything else on this page, including the tax comparison and the range, is calculated in your browser and nothing you type is sent anywhere.
The Tax Question Every Other SCHD Calculator Skips
If you hold SCHD in a taxable brokerage account, every distribution is taxed in the year you receive it, whether or not you reinvest it. That is the part most SCHD dividend calculator pages leave out entirely, and it is not a rounding error.
We ran the numbers through the engine on this page. Ten thousand dollars to start, five hundred a month after that, twenty years, a $32.85 share price and a $1.05 annual dividend, dividend growth of 9.05 percent, price growth of 8.91 percent, and a fifteen percent qualified dividend rate. Those inputs are written out so you can reproduce the result yourself rather than take our word for it:
The reason is compounding. A dollar taken in tax in year three is not just a dollar gone, it is a dollar that never bought a share, so it never paid a dividend, so that dividend never bought another share. The loss keeps growing after the tax is paid. This is why the account you hold SCHD in matters more than most people assume, and why the calculator shows both runs side by side instead of quietly ignoring one.
Which dividend tax rate applies to you
Qualified dividends are taxed at 0, 15 or 20 percent depending on your taxable income and filing status, which is generally lower than ordinary income rates. Whether a particular distribution counts as qualified depends on the fund's own classification and on how long you held the shares. On top of that there may be state tax, and a 3.8 percent net investment income tax above certain income thresholds.
The calculator lets you pick a rate rather than guessing one for you, because the right rate depends on details only you have. The fund's annual tax documents state how its distributions were classified. If real money is involved, check with a tax professional rather than trusting any calculator, including this one.
Taxable, Roth and traditional are three different outcomes
| Account | Dividends taxed each year? | What the calculator does |
|---|---|---|
| Taxable brokerage | Yes, in the year received | Applies your rate, plus state and NIIT if set |
| Roth IRA | No | Runs with no dividend tax applied |
| Traditional IRA or 401(k) | Not while inside | Same as Roth here, but withdrawals are taxed later, which this tool does not model |
That last row matters. A traditional account defers tax rather than removing it, so treating its end balance as equivalent to a Roth balance overstates what you actually get to keep. This calculator models the accumulation phase only.
Why One Projection Number Is Misleading
Every competing SCHD dividend calculator returns a single figure, often to the cent. That precision is not real. Change the growth assumptions by a few percentage points, which is well within what happens over a couple of decades, and the answer moves enormously.
Using the same twenty year run described above, dropping dividend and price growth by four points and raising them by two produces this spread:
That is the honest shape of a long projection, and the calculator shows all three rather than picking the flattering one. If a page hands you one number for a thirty year horizon without a range, the number is doing marketing, not math.
What the growth rates actually mean
Dividend growth is how fast the payout per share rises. Price growth is how fast the share price rises. They are separate, and a fund can do well on one and badly on the other. Trailing averages smooth over years that were nothing like the average, so a fund that grew its dividend at nine percent on average may have had years far above and far below that. Straight line compounding cannot show you that texture, which is the main limitation of every calculator of this type, including this one.
SCHD's 2024 Stock Split, and Why Your Old Numbers Look Wrong
If you are comparing today's roughly thirty dollar share price against notes, screenshots or a cost basis showing eighty something, nothing has gone wrong. Schwab Asset Management split the fund.
Per Schwab's own announcement, SCHD had a 3 for 1 share split with a record date of 9 October 2024, payable 10 October 2024, and post split trading from 11 October 2024. The press release lists SCHD's net asset value at $85.02 per share as of 24 September 2024, immediately before the split.
| Figure | Before the split | After the split |
|---|---|---|
| Share price | divide by 3 | roughly a third |
| Dividend per share | divide by 3 | roughly a third |
| Number of shares you hold | multiply by 3 | three times as many |
| Total value of the position | unchanged | unchanged |
| Dividend yield | unchanged | unchanged |
A split changes nothing about what you own. It slices the same pie into more pieces. The converter in the tool above does the arithmetic if you have an old figure to translate, which matters because feeding a pre split dividend per share into any calculator alongside a post split price produces a result roughly three times too high.
SCHD at a Glance
These come from Schwab Asset Management's own fund page. Figures that move, such as price and yield, are deliberately left out here so this section does not quietly go stale. Check the issuer for current numbers.
| Item | Detail |
|---|---|
| Full name | Schwab U.S. Dividend Equity ETF |
| Index tracked | Dow Jones U.S. Dividend 100 Index |
| Expense ratio | 0.06% per year |
| Inception | 20 October 2011 |
| Distribution frequency | Quarterly, in March, June, September and December |
| Share split | 3 for 1, October 2024 |
What the expense ratio actually costs over thirty years
Six basis points sounds like nothing, and as fees go it is very low. It is still not zero. On ten thousand dollars compounding at eight percent for thirty years, the engine on this page puts the difference between a zero fee run and a 0.06 percent run at roughly $1,660. Small, but real, and it is subtracted here rather than displayed and ignored.
Reading Your Results
Yield on cost
Annual dividend income divided by what you actually put in, rather than by what the position is worth now. It climbs over time as the payout grows against a fixed cost basis. A yield on cost of twelve percent after twenty years does not mean the fund yields twelve percent, it means your original money is throwing off that much.
Total dividends versus end balance
Total dividends is every distribution across the run, before any is reinvested. End balance already contains the reinvested ones. Adding the two together double counts, which is a common mistake when comparing calculators.
In today's money
Every other figure here is nominal, meaning future dollars. The inflation adjusted line converts the end balance into what it would buy today. Over long horizons the gap is severe, and leaving it out is how projections start to feel like promises.
Related Calculators
Other tools on this site that deal with money compounding over time:
- Dividend Calculator, the general version, for any stock or fund you enter yourself, with the same tax and range treatment
- JEPI Dividend Calculator, for a covered call fund where most of the income is taxed at ordinary rates instead of as a qualified dividend
- Savings Goal Calculator, for working backwards from a target instead of forwards from a balance
- Credit Card Payoff Calculator, worth running first, since paying down high interest debt is a guaranteed return
- Cumulative Abnormal Return Calculator and the guide to what CAR measures
- How to save money fast, on freeing up the contribution in the first place
- More in Finance tools
SCHD Dividend Calculator FAQs
What is a SCHD dividend calculator?
It is a dividend reinvestment calculator for the Schwab U.S. Dividend Equity ETF. It projects a position forward, reinvesting each quarterly distribution into more shares so the income compounds. You enter a starting amount, share price, dividend per share, contributions and growth assumptions, and it returns a projected balance, dividend income and yield on cost.
Does this SCHD calculator use the current price?
Yes. The share price and the annual dividend per share load automatically when the page opens, and the label next to Your position shows which date the price is from. The dividend is the last four quarterly payments added together. If the feed cannot be reached the calculator falls back to the last known figures and tells you, and you can always type your own numbers over either field.
How accurate is a SCHD calculator?
The arithmetic is exact, the assumptions are not. It compounds whatever growth rates you enter in a straight line, and real markets never move in a straight line. Changing dividend and price growth by a few points across a twenty year run moved the end balance by more than double in our own testing, which is why this page shows a range rather than one number.
How often does SCHD pay dividends?
Quarterly. Schwab Asset Management's fund page states distributions are paid in March, June, September and December. The calculator uses that schedule rather than spreading payments evenly, so the reinvestment timing matches what actually happens.
Are SCHD dividends taxed if I reinvest them?
In a taxable brokerage account, yes. Reinvesting does not defer the tax, because you are treated as having received the distribution and then bought more shares with it. In a Roth or traditional IRA no tax applies while the money stays inside. This is why the calculator runs both and shows the gap.
What tax rate applies to SCHD dividends?
Qualified dividends are taxed at 0, 15 or 20 percent depending on taxable income and filing status, and whether a distribution qualifies depends on the fund's classification and your holding period. State tax and the 3.8 percent net investment income tax may apply on top. The calculator lets you choose a rate rather than assuming one, and a tax professional is the right check before real money moves.
Is SCHD better in a Roth IRA or a taxable account?
Mathematically, sheltering the dividends removes the annual tax drag, and in our twenty year test the sheltered run ended roughly 2.2 times the tax actually paid ahead of the taxable one. Whether that makes a Roth the right home for it depends on your contribution room, your other holdings and your own tax position, which is a decision for you or an adviser rather than a calculator.
Did SCHD do a stock split?
Yes. Schwab Asset Management carried out a 3 for 1 share split with a record date of 9 October 2024, payable 10 October 2024, with post split trading from 11 October 2024. The announcement listed SCHD's net asset value at $85.02 per share as of 24 September 2024. A split does not change the value of what you hold, only the number of pieces it is divided into.
What is yield on cost, and why does it keep rising?
Yield on cost is annual dividend income divided by what you originally invested, rather than by the current value. Because the cost basis is fixed and the payout grows, the figure climbs over time. It is a measure of how hard your original money is working, not a yield you could buy today.
Does this SCHD dividend calculator include the expense ratio?
Yes. The 0.06 percent expense ratio is subtracted from the price growth rate rather than shown as a statistic and then ignored. Over a thirty year run on ten thousand dollars at eight percent, that fee costs roughly $1,660, which is small but is at least accounted for here.
Is this SCHD calculator free, and is it investment advice?
It is free with no signup, no account and no limit, and everything runs in your browser so nothing you enter is sent anywhere. It is not investment advice, not tax advice and not a recommendation to buy or sell anything. It is a projection model, and past performance is no guarantee of future results.
Limits and Disclaimer
This page models the accumulation phase only. It does not model withdrawals, taxes on traditional account distributions, brokerage commissions, bid ask spreads, fractional share policies that differ between brokers, changes to the underlying index, or the possibility that a dividend is cut. It assumes distributions are reinvested at the prevailing price with no delay, which real brokers do not always manage.
Calcxi is an independent tools site with no affiliation to Charles Schwab, Schwab Asset Management or the Dow Jones indices. Fund facts on this page come from the issuer and are dated. Nothing here is investment, tax or financial advice, and no part of it is a recommendation to buy or sell any security. Projections are models built on assumptions you chose, and they will be wrong. Past performance is no guarantee of future results. Speak to a licensed financial adviser before making investment decisions.

Written & verified by
B.Tech Computer Science · 8 years in web development & SEO · Bhilwara, India
About ·
LinkedIn ·
Report an error