
JEPI Dividend Calculator
Project a JPMorgan Equity Premium Income ETF position with distributions reinvested every month. This JEPI calculator is the only one that taxes the income the way the IRS actually does, because most of what JEPI pays is not a qualified dividend.
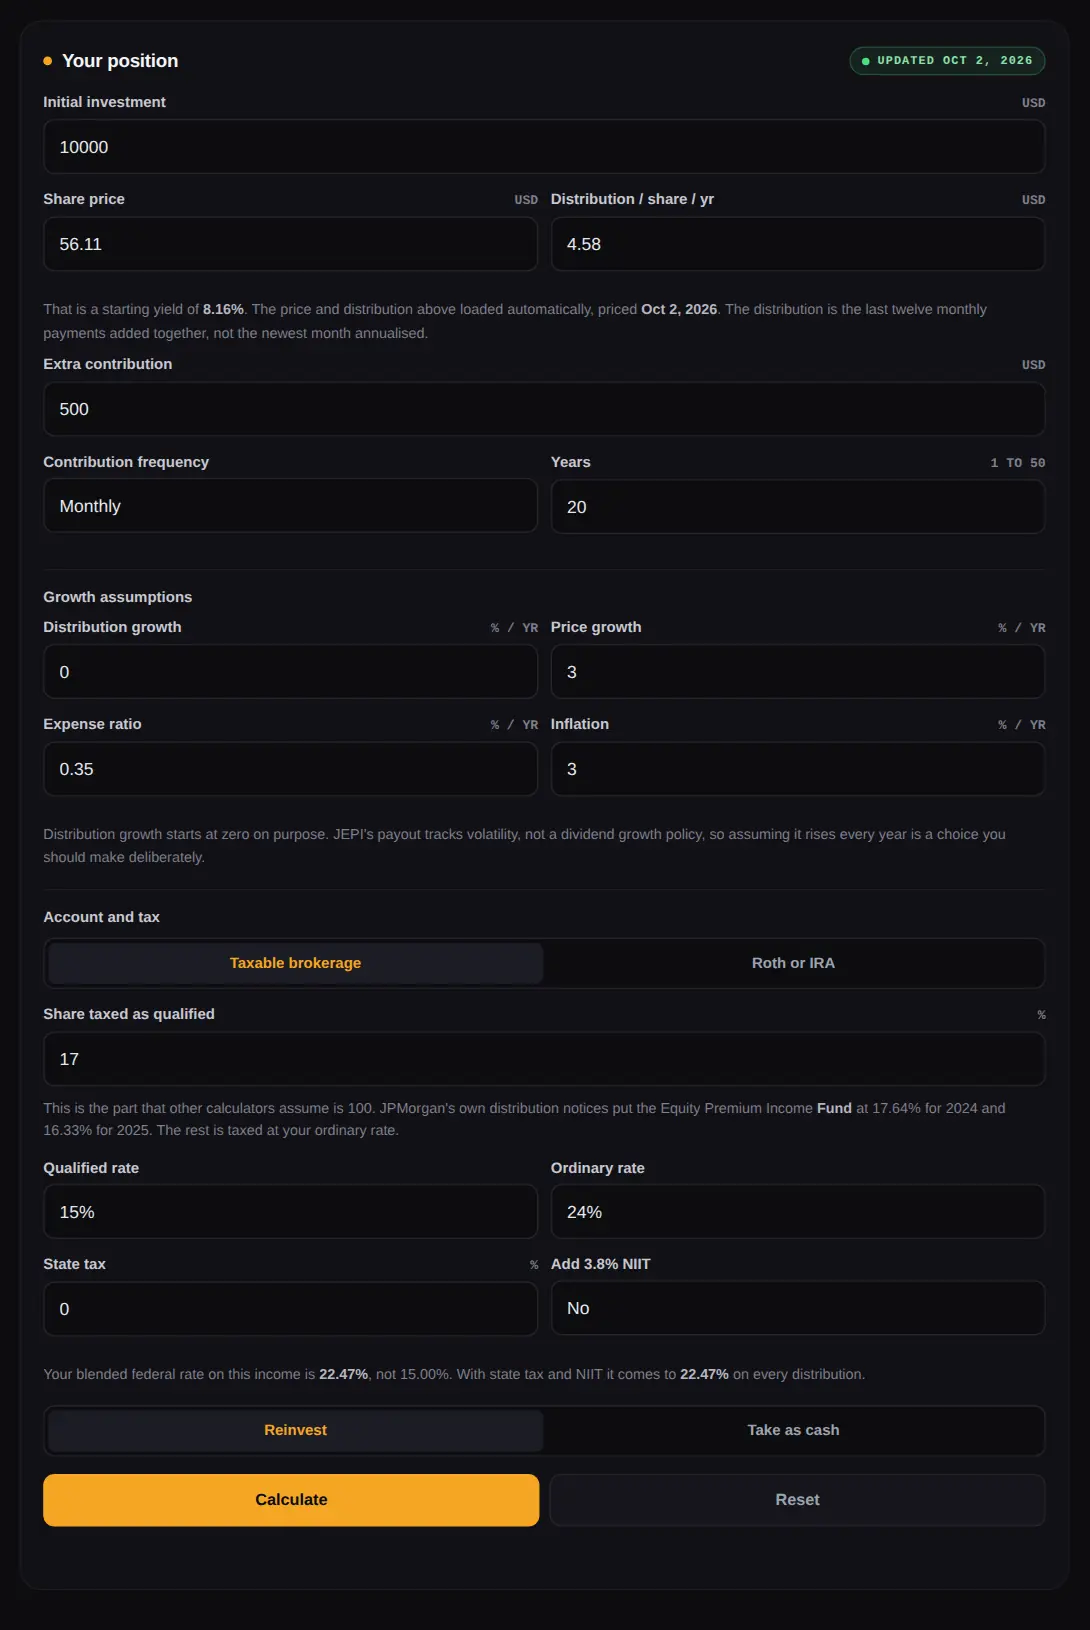
Your position
Loading priceDistribution growth starts at zero on purpose. JEPI's payout tracks volatility, not a dividend growth policy, so assuming it rises every year is a choice you should make deliberately.
This is the part that other calculators assume is 100. JPMorgan's own distribution notices put the Equity Premium Income Fund at 17.64% for 2024 and 16.33% for 2025. The rest is taxed at your ordinary rate.
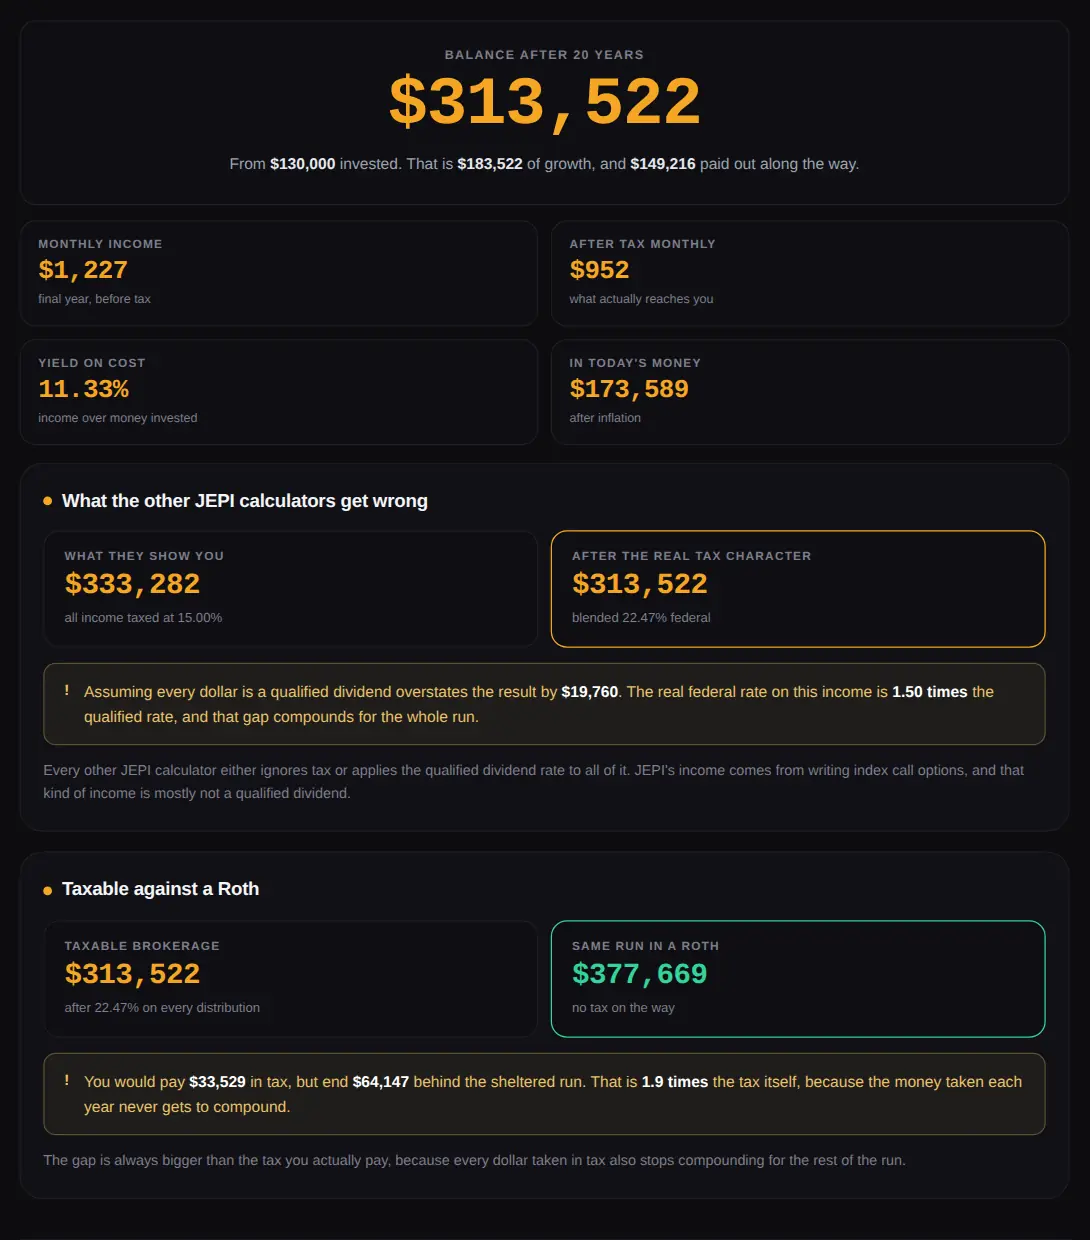
What the other JEPI calculators get wrong
Every other JEPI calculator either ignores tax or applies the qualified dividend rate to all of it. JEPI's income comes from writing index call options, and that kind of income is mostly not a qualified dividend.
Taxable against a Roth
The gap is always bigger than the tax you actually pay, because every dollar taken in tax also stops compounding for the rest of the run.
The range the payout actually produces
Year by year
| Year | Shares | Price | Dist / share | Distributions | Tax | Yield on cost | Balance |
|---|---|---|---|---|---|---|---|
| Press Calculate to build the table. | |||||||
Runs entirely in your browser · Nothing you enter is sent anywhere · Not investment, tax or financial advice · Past performance is no guarantee of future results
What This JEPI Dividend Calculator Does
This JEPI dividend calculator projects a position in the JPMorgan Equity Premium Income ETF forward, reinvesting each monthly distribution into more shares. That is the same snowball every dividend calculator models. The difference here is what happens to the money in between.
JEPI does not pay an ordinary dividend. Most of what it distributes comes from selling index call options, and that income is largely not a qualified dividend, which means it is taxed at your ordinary rate rather than the lower one. Every other JEPI calculator either skips tax entirely or quietly applies the qualified rate to all of it. On an eight percent yield compounded for two decades, that is not a rounding error.
How to Use the JEPI Calculator
- Enter what you are starting with. The share price and the trailing distribution fill in on their own, and the label beside Your position shows the date the price is from.
- Add anything you plan to contribute each month.
- Set the share taxed as qualified. The default of 17 percent comes from JPMorgan's own filings, explained below. Set it to 100 and you will see exactly what the other calculators are showing you.
- Pick your ordinary rate. For this fund that matters far more than the qualified rate.
- Read the range as well as the headline, and check the year by year table to see where the income actually arrives.
Where the price and distribution come from
Both load automatically when the page opens. The distribution figure is the last twelve monthly payments added together, which is the trailing twelve month number. It is deliberately not the newest month multiplied by twelve, because JEPI's months differ enough that annualizing one of them produces a figure that was never true. If the feed cannot be reached the calculator keeps working with the last figures it knows and says so.
The Tax Problem Every Other JEPI Calculator Ignores
JPMorgan publishes a distribution notice every year telling shareholders how much of the income qualified for the lower dividend rate. For the JPMorgan Equity Premium Income Fund, the figures were:
| Tax year | Qualified dividend income | Taxed as ordinary income |
|---|---|---|
| 2024 | 17.64% | 82.36% |
| 2025 | 16.33% | 83.67% |
An honest note on what that table is. Those notices name the Equity Premium Income Fund, which is the mutual fund running this strategy, not the ETF. JPMorgan does not publish the equivalent figure for the ETF, so this page does not claim one. What the numbers tell you is the shape of the problem for a strategy built on option premium, and two years running it was roughly five sixths.
Put that through the calculator. Ten thousand dollars, five hundred a month, twenty years, a $56.11 share price and a $4.58 trailing distribution, three percent price growth, and the 24 percent federal bracket:
The blended federal rate on that income is 22.47 percent, not the 15 percent a qualified dividend would attract. That is one and a half times the rate, and it is charged every year, so the loss compounds rather than sitting still. Move to the 32 percent bracket and the blended rate becomes 29.11 percent, nearly double, and the overstatement grows to $36,146.
None of this means JEPI is a bad holding. It means the number you have probably seen quoted for it was computed with the wrong tax rate, and the gap widens the more tax you pay.
Why this points so strongly at a sheltered account
On the same run, a Roth or IRA ends at $377,669 against $313,522 in a taxable brokerage. You would pay $33,529 in tax along the way but finish $64,147 behind, which is 1.9 times the tax bill. The gap is always larger than the tax itself, because every dollar taken in tax also stops buying shares. For a fund paying mostly ordinary income, that argument is stronger than it is for a conventional dividend ETF.
JEPI's Payout Is Not a Dividend Schedule
A dividend growth fund raises its payout on a policy. JEPI does not have one. Its income comes from option premium, premium depends on volatility, and volatility does what it likes. Here is what the fund actually paid over the twelve months to September 2026:
| Ex date | Amount | Ex date | Amount |
|---|---|---|---|
| 1 Sep 2026 | $0.37142 | 2 Mar 2026 | $0.35134 |
| 3 Aug 2026 | $0.36664 | 2 Feb 2026 | $0.34443 |
| 1 Jul 2026 | $0.38716 | 31 Dec 2025 | $0.42709 |
| 1 Jun 2026 | $0.38921 | 1 Dec 2025 | $0.37060 |
| 1 May 2026 | $0.44761 | 3 Nov 2025 | $0.34636 |
| 1 Apr 2026 | $0.42050 | 1 Oct 2025 | $0.36102 |
The strongest month paid 30 percent more than the weakest. Repeat the weak month for twenty years and the run ends at $294,822; repeat the strong one and it ends at $349,831. More usefully for anyone buying this fund for income, the final monthly payment lands somewhere between $1,042 and $1,601.
That is the honest shape of this fund, and it is why the calculator shows a band built from JEPI's own best and worst month rather than a single figure. A tool that asks for one yield percentage and multiplies cannot show you any of it.
The part people get backwards
All of that volatility sits in the monthly payment, not in the yearly total. When one month rolls off the trailing twelve month figure and a new one rolls on, the annual number moves by at most 0.19 percent. So the right way to read JEPI is that your timing is unpredictable while your year is reasonably steady. People who describe the income as unreliable are describing the month, not the year.
Where JEPI's Income Actually Comes From
JPMorgan's own fund literature describes the mechanism plainly. The fund runs a
disciplined options overlay
that writes out of the money S&P 500 index call options
that seek to generate distributable monthly income
, and it calls the monthly payout of all income earned
a unique feature of the fund.
Two consequences follow, and both change what a projection should look like. Option premium is not dividend income, which is the tax story above. And writing calls caps the upside, because shares called away stop participating once the index runs past the strike. That is why the price growth field on this page defaults to three percent rather than the eight or nine you would put against a broad equity fund. It is a setting you should think about rather than inherit.
JEPI at a Glance
| Fund | JPMorgan Equity Premium Income ETF |
| Inception | 20 May 2020 |
| Expense ratio | 0.35% |
| Distributions | Monthly |
| Income source | Equity portfolio plus written S&P 500 index call options |
| Tax character | Mostly ordinary income, see the notice figures above |
The inception date, expense ratio, monthly schedule and the description of the options overlay all come from JPMorgan's own fund documents. No live price or yield is printed in this table on purpose, because prose cannot carry a date stamp the way a form field can. The live figures sit in the calculator, labeled with the day they are from.
Is the Monthly Payout Worth Anything?
Monthly income is the line JEPI is sold on, so it is worth measuring rather than assuming. Running the same position with distributions reinvested monthly against the identical position reinvested quarterly, over twenty years, the monthly schedule finishes 0.66 percent ahead.
That is real and it is small. If you are living on the income, monthly payments are genuinely more convenient than quarterly ones and that convenience is the actual benefit. If you are reinvesting, the compounding advantage is a fraction of a percent and should not be the reason you choose the fund.
Reading Your Results
Yield on cost climbs even when nothing improves
Yield on cost rises in this projection even with distribution growth set to zero, because reinvestment keeps adding shares while the money you put in stays fixed. It is a measure of how much your position has grown, not evidence that the fund is paying more.
The after tax monthly figure is the one to look at
The results show gross and after tax monthly income side by side. On the default run those are $1,227 and $952. For a fund bought specifically for income, the second number is the one that reaches your account, and for JEPI the gap between them is wider than it would be for a qualified dividend payer.
Set the qualified share to 100 once
It is worth doing once, just to see the difference. That single setting is what separates this projection from every other JEPI calculator on the web.
Related Calculators
If you are weighing JEPI against a conventional dividend ETF, the SCHD dividend calculator runs the same engine with the tax treatment a qualified dividend payer actually gets, which makes the comparison a fair one. The dividend calculator is the general version of the same engine, for any holding you enter yourself. For the money going in each month, the savings goal calculator works backwards from a target, and how to save money fast covers freeing up the contribution in the first place. More tools sit on the finance hub.
JEPI Dividend Calculator FAQs
What is a JEPI dividend calculator?
It projects a position in the JPMorgan Equity Premium Income ETF forward, reinvesting each monthly distribution into more shares so the income compounds. You enter a starting amount, share price, distribution per share, contributions and growth assumptions, and it returns a projected balance, monthly income and yield on cost. This one also applies the tax treatment JEPI's income actually receives.
Are JEPI dividends qualified or ordinary income?
Mostly ordinary. JEPI generates income by writing S&P 500 index call options, and option premium is not qualified dividend income. JPMorgan's distribution notices for the Equity Premium Income Fund, the mutual fund running the same strategy, reported qualified dividend income of 17.64 percent for 2024 and 16.33 percent for 2025. JPMorgan does not publish the equivalent figure for the ETF.
Does this JEPI calculator use the current price?
Yes. The share price and the trailing twelve month distribution load automatically when the page opens, and the label beside Your position shows which date the price is from. The distribution is the last twelve monthly payments added together rather than the newest month annualized. If the feed cannot be reached the calculator falls back to its last known figures and tells you.
How often does JEPI pay distributions?
Monthly. JPMorgan describes the monthly payout of all income earned as a feature of the fund. The amounts vary from month to month because they depend on the option premium collected, which moves with volatility.
Why does JEPI's monthly payment change so much?
Because the income comes from selling options rather than from company dividends. Over the twelve months to September 2026 the payment ranged from $0.34443 to $0.44761 per share, a gap of 30 percent. The trailing twelve month total is far steadier than the individual months, moving by at most 0.19 percent as one month replaces another.
Is JEPI better in a Roth IRA or a taxable account?
The arithmetic favors sheltering it more strongly than it would a qualified dividend fund, because the income is taxed at ordinary rates. On a twenty year run at the 24 percent bracket, the sheltered version ended about 1.9 times the tax actually paid ahead of the taxable one. Whether that makes a Roth the right home depends on your contribution room and your other holdings, which is a decision for you or an adviser rather than a calculator.
What is JEPI's expense ratio?
0.35 percent, as stated in JPMorgan's own fund literature. This calculator subtracts it from price growth each year rather than displaying it as trivia, so it actually affects the projected balance.
Does writing call options limit JEPI's growth?
Yes. The fund writes out of the money index calls, so when the market runs past the strike those shares stop participating in the gain. That is the trade being made for the income. It is why the price growth field on this page defaults to a modest figure rather than a broad market assumption, and you should set it deliberately.
Is monthly income actually better than quarterly?
For compounding, barely. Reinvesting monthly instead of quarterly over twenty years finished 0.66 percent ahead in our own testing. For someone spending the income rather than reinvesting it, monthly payments are genuinely more convenient, and that convenience is the real benefit rather than the compounding.
Is this JEPI calculator free, and is it investment advice?
It is free, requires no account, and everything is calculated in your browser so nothing you enter is sent anywhere. It is not investment advice. It is a projection model built on assumptions you supply, and real markets do not move in straight lines.
Limits and Disclaimer
This page is a model. It compounds the rates you enter, in a straight line, for as long as you ask, and real markets never do that. The tax treatment is simplified: it applies a blended federal rate plus whatever state tax and net investment income tax you set, and it does not model bracket changes, the alternative minimum tax, capital gains on shares you eventually sell, or any return of capital the fund may report. The qualified share defaults to a figure drawn from the mutual fund version of this strategy, which is the closest published number rather than the ETF's own.
I am not a financial adviser and nothing here is investment, tax or financial advice. Verify the current price, the current distribution and your own tax position before acting on any number on this page, and talk to a tax professional about how these distributions land in your particular situation.

Written & verified by
B.Tech Computer Science · 8 years in web development & SEO · Bhilwara, India
About ·
LinkedIn ·
Report an error