
Dividend Calculator
Project any dividend stock or ETF forward with payouts reinvested. This dividend calculator taxes the income properly, shows a range rather than one false-precision number, and tells you the year your income actually covers a bill in today's money.
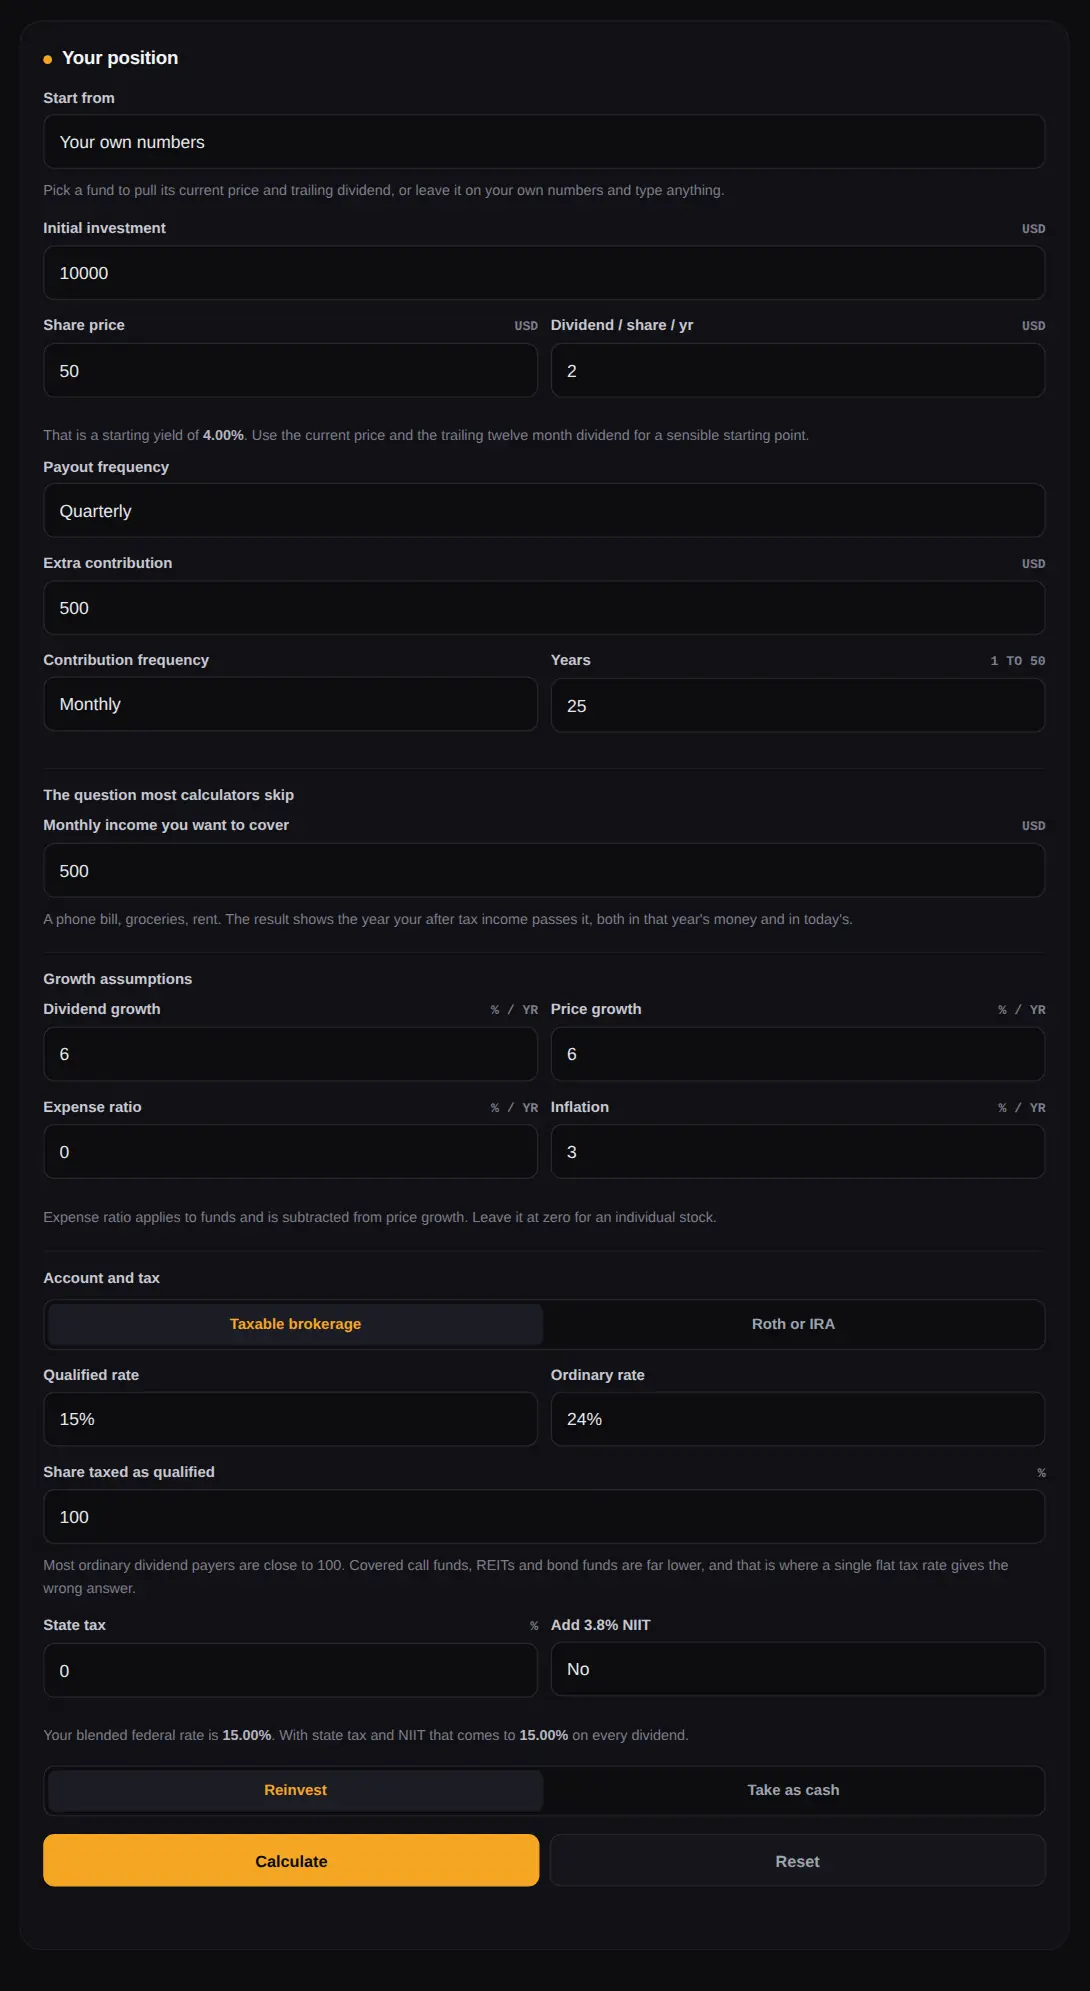
Your position
LoadingPick a fund to pull its current price and trailing dividend, or leave it on your own numbers and type anything.
A phone bill, groceries, rent. The result shows the year your after tax income passes it, both in that year's money and in today's.
Expense ratio applies to funds and is subtracted from price growth. Leave it at zero for an individual stock.
Most ordinary dividend payers are close to 100. Covered call funds, REITs and bond funds are far lower, and that is where a single flat tax rate gives the wrong answer.
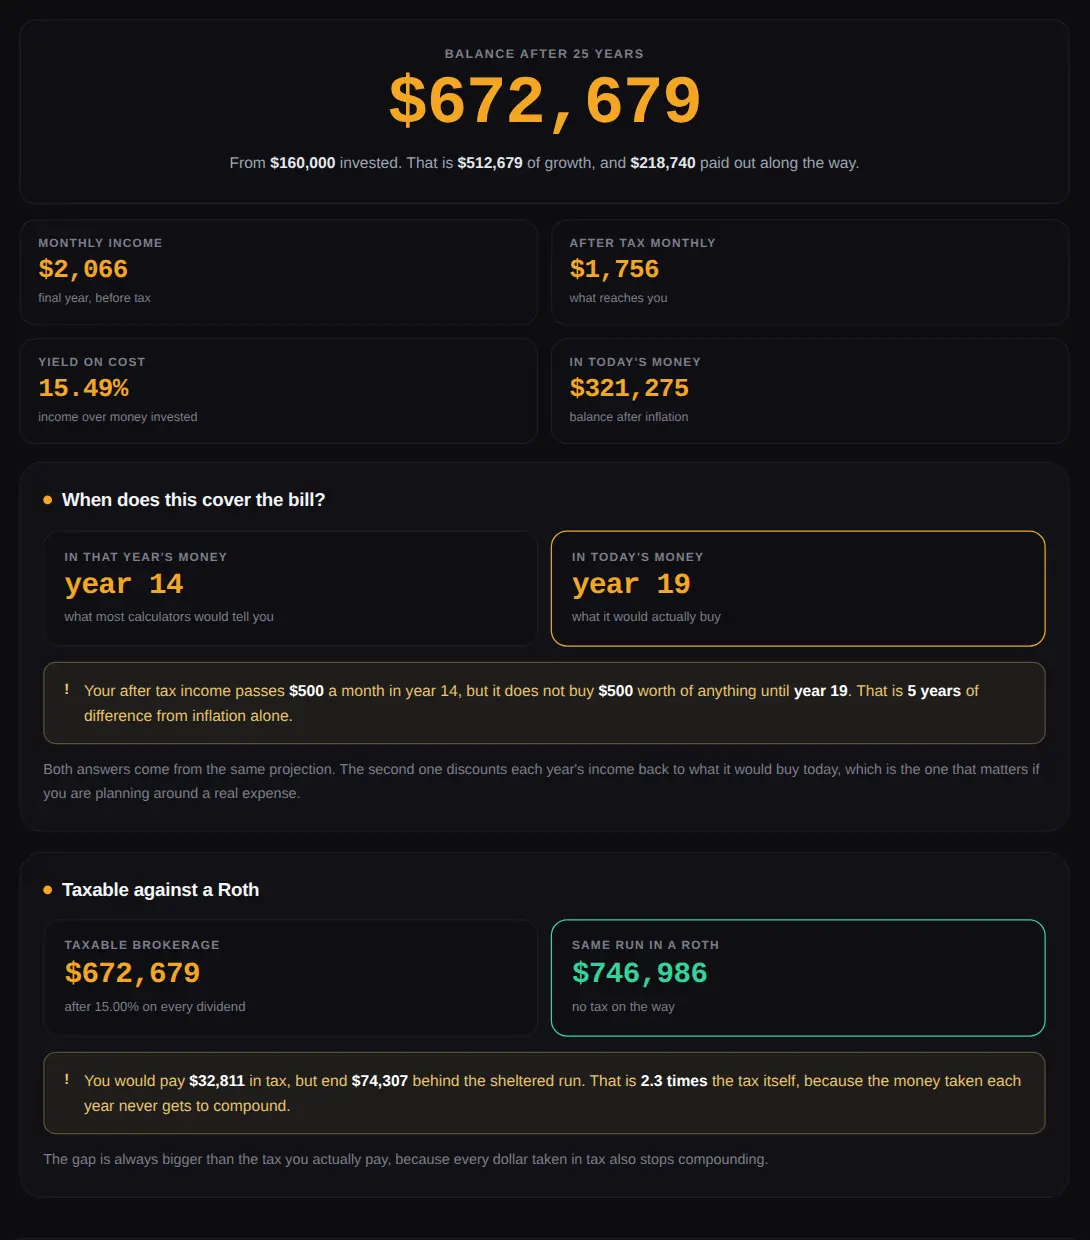
When does this cover the bill?
Both answers come from the same projection. The second one discounts each year's income back to what it would buy today, which is the one that matters if you are planning around a real expense.
Tax character
Taxable against a Roth
The gap is always bigger than the tax you actually pay, because every dollar taken in tax also stops compounding.
The range, not the number
Year by year
| Year | Shares | Price | Div / share | Dividends | Tax | Monthly after tax | Balance |
|---|---|---|---|---|---|---|---|
| Press Calculate to build the table. | |||||||
Runs entirely in your browser · Nothing you enter is sent anywhere · Not investment, tax or financial advice · Past performance is no guarantee of future results
What This Dividend Calculator Does
This dividend calculator takes any dividend paying stock or fund, reinvests each payout into more shares, and projects the position forward. That part is standard. Three things here are not, and all three change the answer rather than decorating it.
It tells you the year your income actually covers a bill, in today's money as well as the raw figure. It splits dividend tax between the qualified and ordinary rates instead of asking for one number that does not exist. And it returns a range, because a dividend reinvestment calculator that quotes a single figure twenty five years out is not being precise, it is being confident.
How to Use It
- Enter the share price and the dividend per share for a year. The trailing twelve month figure is the sensible one to use. If you want a quick starting point, the dropdown pulls live figures for two funds.
- Set the payout frequency. Monthly, quarterly, twice a year and once a year all compound differently when you reinvest.
- Add what you plan to contribute, and over how many years.
- Enter the monthly expense you want the income to cover. This is the field that produces the most useful answer on the page.
- Set your tax rates. If you are not sure what share of your dividends is qualified, leave it at 100 for an ordinary dividend payer and read the section below for when it is not.
The Year Your Dividends Cover a Bill
Nobody opens a dividend calculator because they want a balance. They want to know when the income starts paying for something. The problem is that a dollar of dividend income in year twenty does not buy what a dollar buys now, and almost every tool quotes the raw figure as though it does.
Take the default run on this page. Ten thousand dollars to start, five hundred a month after that, a four percent yield growing at six percent a year, twenty five years, three percent inflation, and the fifteen percent qualified dividend rate:
| Monthly bill | Covered in year | Covered in today's money | Difference |
|---|---|---|---|
| $250 | 9 | 11 | 2 years |
| $500 | 14 | 19 | 5 years |
| $1,000 | 20 | never within 25 | — |
| $1,500 | 24 | never within 25 | — |
That last row is the one worth sitting with. A calculator showing you year 20 for a thousand dollars a month is not lying about the arithmetic. It is answering a different question from the one you asked. You did not want a thousand future dollars, you wanted a thousand dollars worth of groceries.
This is not an argument against dividend investing. It is an argument for setting the target in today's money and reading the second column.
Why the Headline Number Is Not What You Will Have
The same effect sits underneath the balance. That default run ends at $672,679. In today's money it is $321,275.
Both figures are correct and both are shown. The nominal one is what will appear on your statement. The real one is what it will be worth. Any projection that only prints the first is handing you the flattering half.
One Tax Rate Is the Wrong Number
Most dividend calculators that handle tax at all give you a single box labeled dividend tax rate. In the United States there is no such thing as one dividend tax rate.
Qualified dividends are taxed at 0, 15 or 20 percent depending on your income and filing status. Everything that does not qualify is taxed at your ordinary income rate, which runs from 10 to 37 percent. Most of what a conventional dividend payer distributes is qualified, so a single box is close enough. But for a covered call fund, a REIT, a bond fund or a business development company, a large share is not qualified, and the single box is wrong by a wide margin.
So this calculator asks two rates and the split between them. Leave the qualified share at 100 and it behaves like every other tool. Drop it to 20 and watch the projection fall, because that is the fund you are actually holding. State tax and the 3.8 percent net investment income tax sit on top of both, which no competing calculator accounts for either.
Where the account you hold it in shows up
On the default run, a Roth or IRA ends at $746,986 against $672,679 in a taxable brokerage. You pay $32,811 in tax along the way but finish $74,307 behind, which is 2.3 times the tax bill. The gap is always bigger than the tax itself, because every dollar taken in tax also stops buying shares, and that lost share never pays a dividend again.
Why a Range Beats a Single Figure
Move dividend growth down three points and up two, which is well inside what twenty five years can do to any company's payout policy, and the same run ends anywhere from $556,317 to $810,480. The top of the band is 1.46 times the bottom.
Nothing else changed. Same money, same contributions, same years, same share price path. Only the rate at which the dividend grows, which is the one input nobody can actually know. If a calculator hands you one number for a quarter century horizon, the number is doing marketing rather than math.
How Much Do You Need Invested to Live on Dividends?
The calculator works forwards from what you have. This is the same arithmetic run backwards, which is the question people usually ask first. The figures below are the capital needed to produce a given monthly income after a fifteen percent qualified dividend rate, so they are what you would actually receive rather than the headline yield.
| Monthly income | At 3% yield | At 4% yield | At 6% yield | At 8% yield |
|---|---|---|---|---|
| $500 | $235,294 | $176,471 | $117,647 | $88,235 |
| $1,000 | $470,588 | $352,941 | $235,294 | $176,471 |
| $2,000 | $941,176 | $705,882 | $470,588 | $352,941 |
| $4,000 | $1,882,353 | $1,411,765 | $941,176 | $705,882 |
Two things are worth noticing before the high yield column starts looking attractive. The tax is doing real work: the same $1,000 a month needs $352,941 at four percent in a taxable account but $300,000 in a Roth, a difference of nearly fifty three thousand dollars of capital for the identical income.
And a yield of eight percent is rarely eight percent of the same thing. High yields usually come with something attached, whether that is a payout funded by selling options, a share price that erodes, or a distribution taxed at ordinary rates rather than qualified. The table assumes the yield holds and the capital does not shrink, which is exactly the assumption that tends to fail at the right hand side.
Use these as a target to work towards rather than a plan. The calculator above is the honest version, because it also tells you what the income will be worth by the time you get there.
Reading Your Results
Yield on cost climbs without the fund doing anything
Yield on cost rises in every reinvested projection, partly because the dividend grows and partly because you keep buying more shares. It measures how your position has grown relative to what you put in. It is not evidence that the holding has become better.
Payout frequency matters less than people think
Reinvesting monthly compounds faster than reinvesting quarterly, but the difference over decades is a fraction of a percent, not a reason to pick one holding over another. Change the frequency in the tool and watch how little moves. Frequency matters for convenience when you are spending the income, not for compounding.
Set the dividend growth rate deliberately
It is the single most powerful input on the page, as the range above shows, and it is the one most people type without thinking. A company's past dividend growth is a starting point, not a commitment, and payouts get cut.
Dividend Calculator FAQs
What is a dividend calculator?
It projects a dividend paying investment forward over time, reinvesting each payout into more shares so the income compounds. You enter a share price, the dividend per share, contributions and growth assumptions, and it returns a projected balance, dividend income and yield on cost. This one also applies tax, adjusts for inflation and shows a range rather than a single figure.
How do you calculate dividend income?
Multiply the number of shares you hold by the dividend per share for the year. If the payout is quarterly, each payment is a quarter of that annual figure. Reinvesting means each payment buys more shares at the price on that date, so the next payment is slightly larger. That compounding is what this calculator models month by month.
How long until dividends cover my bills?
That depends on the amount invested, the yield, how much you add and how fast the dividend grows. The calculator answers it directly: enter the monthly figure you want covered and it reports the year your after tax income passes it. It gives two answers, one in that year's money and one in today's, and the second is usually several years later.
Are dividends taxed if you reinvest them?
In a taxable brokerage account, yes. Reinvesting does not defer anything, because you are treated as having received the dividend and then bought more shares with it. In a Roth or traditional IRA no tax applies while the money stays inside. Switch the account type in the tool to see the difference over your own time frame.
What is the difference between qualified and ordinary dividends?
Qualified dividends are taxed at the long term capital gains rates of 0, 15 or 20 percent. Dividends that do not qualify are taxed at your ordinary income rate, which can reach 37 percent. Whether a dividend qualifies depends on the payer and how long you held the shares. Covered call funds, REITs and bond funds distribute a large share that does not qualify.
Does dividend payout frequency change the result?
Only slightly, and only if you reinvest. More frequent payments start compounding sooner, so monthly finishes marginally ahead of quarterly over a long run. The difference is a fraction of a percent, far smaller than the effect of the dividend growth rate or the tax rate. If you are spending the income rather than reinvesting, frequency is about convenience.
What is yield on cost?
Annual dividend income divided by the total amount you have invested, rather than by the current market value. It rises over time when dividends grow or when you reinvest, which makes it look like a performance measure. It is not one. It describes your position's history, not the quality of the holding today.
How accurate is a dividend calculator?
The arithmetic is exact, the assumptions are not. It compounds whatever rates you enter in a straight line, and no real investment does that. Moving dividend growth by a few points across a twenty five year run changed the end balance by nearly half in our own testing, which is why this page shows a range rather than one number.
Can I use this for a stock rather than a fund?
Yes. Leave the expense ratio at zero, since individual shares do not have one, and enter the company's annual dividend per share and payout frequency. Everything else works the same. Bear in mind that a single company can cut its dividend entirely, which a projection cannot anticipate, so the lower end of the range matters more for one stock than for a diversified fund.
Is this dividend calculator free?
Yes. No account, no signup, and everything is calculated in your browser, so nothing you enter is sent anywhere or stored. It is not investment advice. It is a projection model built on assumptions you supply.
Related Calculators
For two specific funds the figures load automatically and the content goes deeper into what each one actually pays. The SCHD dividend calculator covers a conventional dividend ETF, and the JEPI dividend calculator covers a covered call fund where most of the income is taxed at ordinary rates, which is the case the qualified share field here exists for.
For the money going in each month, the savings goal calculator works backwards from a target, and how to save money fast covers freeing up the contribution. More tools sit on the finance hub.
Limits and Disclaimer
This page is a model. It compounds the rates you enter, in a straight line, for as long as you ask, and real markets never do that. Dividends get cut, companies get taken over, and funds change what they hold. The tax treatment is simplified: it applies a blended federal rate plus whatever state tax and net investment income tax you set, and it does not model bracket changes, the alternative minimum tax, capital gains when you eventually sell, or any return of capital a fund may report.
I am not a financial adviser and nothing here is investment, tax or financial advice. Check the current price, the current dividend and your own tax position before acting on any number on this page, and talk to a tax professional about your particular situation.

Written & verified by
B.Tech Computer Science · 8 years in web development & SEO · Bhilwara, India
About ·
LinkedIn ·
Report an error