
The claim shows up constantly: men are too picky, they’re chasing women out of their league, and their expectations have drifted loose from reality. It’s a satisfying argument. It’s also mostly untested.
When you go looking for US data on the question, something awkward turns up. On the two standards people argue about most, money and height, American surveys consistently find women reporting stricter requirements than men, not the other way around. That doesn’t mean men have no unrealistic expectations. It means the popular version of this debate has the shape of the evidence wrong, and the more useful question isn’t about men or women at all.
The Short Answer
There’s no good evidence that American men, as a group, hold unusually high dating standards. US surveys find women report stricter requirements around income, employment, education and height, while men report more selectivity about age and physical appearance. Men do behave more aspirationally on dating apps, which is a different thing from being selective. Whether any individual’s standards are unrealistic depends on how rare their specific combination is.
What "High Standards" Actually Means
Most of the argument happens because people use one phrase for four different things.
A preference is something you’d like. A standard is a bar you apply. A deal-breaker is a requirement you won’t cross regardless of everything else. An unrealistic expectation is a combination so rare that meeting it is statistically improbable, or one you’d never satisfy if it were applied to you.
Someone who’d prefer a partner over six feet but has dated shorter men has a preference. Someone who filters them out on an app has a standard. Someone who ends an otherwise good relationship over it has a deal-breaker. These get flattened into “high standards” in a way that makes the conversation impossible to settle.
The distinction matters because the count is what does the damage, not the individual item. One firm requirement rarely shrinks a pool much. Five of them, applied at once, can.
Are Men More Selective Than Women? What US Surveys Show
On the specific traits people usually mean, women report more selectivity. This finding is consistent across independent surveys.
The Survey Center on American Life’s American Perspectives Survey polled 5,055 US adults in December 2022 and asked what would make respondents less likely to date someone:
| Trait | Women who’d be less likely to date | Men who’d be less likely to date |
|---|---|---|
| Doesn’t have a job | 81% | 56% |
| Is much shorter than them | 56% | 11% |
| Doesn’t have a college degree (among college-educated respondents) | 54% | 44% |
The height gap is the widest in the survey. Fifty-six percent versus eleven percent isn’t a modest difference in emphasis.
The Institute for Family Studies and YouGov found the same pattern in a younger sample. Their April 2025 survey of 2,000 men and 1,000 women aged 18–29 found 58% of young women rated a partner having a stable job “very important,” against 40% of young men, the second-largest gender gap in the entire study.
That survey also complicates the stereotype in an interesting way. Among liberal young women, 60% rated shared political views as very important, ranking it above a partner’s earning potential at 32%. The “provider” expectation is real but it is not the top filter for every group, and anyone claiming a single unified female standard is overreading the data.
Since these questions come up together, we’ve looked at the reverse case in a companion piece on whether women’s dating standards are too high, which runs the same population math from the other direction.
Where men do report more selectivity
Men aren’t less selective across the board. They’re selective on different axes. Research consistently finds men place more stated weight on physical attractiveness and on partner age, with a preference for younger partners that widens as men get older. Both are real, both are measurable, and both can produce genuinely unrealistic expectations when pushed hard.
So the accurate summary isn’t that one sex is pickier. It’s that the two sexes tend to be picky about different things, and the traits men prioritize are harder to put a census number on than height and income.
The Problem With Asking People What They Want
Here’s the finding that should temper every survey result above, including the ones supporting the article’s own argument.
In 2008, Paul Eastwick and Eli Finkel ran a study published in the Journal of Personality and Social Psychology. They surveyed 163 undergraduates about what they wanted in a partner, then put them through a speed-dating event with 4-minute dates, then followed them for 30 days to see who actually pursued whom.
The stated preferences came out exactly as the stereotype predicts. Men rated physical attractiveness as more important than women did. Women rated earning prospects as more important than men did. Both differences were statistically solid.
Then those preferences failed to predict anything. As the authors put it, participants’ “stated preferences were unrelated to their in vivo preferences.” The men who said looks mattered most weren’t more drawn to the most attractive partners. The women who said earning potential mattered weren’t more drawn to the highest earners.
This has a specific implication for the question at hand. When someone tells a pollster their requirements, you’re learning what they believe about themselves, which is not the same as learning who they’ll actually fall for. It’s a genuine limitation on survey-based claims about standards including the claim that men’s are too high, and including the counter-claim.
The sample was small and undergraduate, so it’s a caution rather than a refutation. But it’s been influential for a reason, and it’s the reason to be skeptical of anyone citing a single preference survey as proof of anything.
What Men Actually Look For
Across the research, men’s stated priorities cluster around physical attractiveness, age, warmth and kindness, and increasingly, shared values and relationship goals.
The attractiveness finding is the most replicated sex difference in the literature and it’s real at the level of stated preference. What it doesn’t support is the caricature. Men in long-term relationship contexts consistently rate kindness, emotional stability and compatibility highly, and the gap between men and women on those traits is small. The sex difference is in relative emphasis, not in whether men care about character.
The IFS data adds a wrinkle worth noting: more than 70% of young men said men should protect women, and a similar share of young women agreed. Whatever else has changed, that expectation has not.
What Women Actually Look For
Women’s stated priorities cluster around stability, ambition, emotional maturity, kindness, humor, height and financial security, with the relative weight shifting substantially by age, politics and education.
The employment finding is the sturdiest one in US data. Across both surveys cited above, a partner having a job registers as close to a baseline requirement rather than a preference. That’s a meaningful standard, though also a fairly attainable one for most employed men.
Where it becomes restrictive is when a specific income floor gets attached to it, which is where population math starts to matter.
The Height Standard: What the CDC Data Shows
Height is the easiest standard to check against real numbers, because the CDC physically measures Americans rather than asking them.
The National Health and Nutrition Examination Survey measured 2,690 US men aged 20 and over between August 2021 and August 2023. The results:
| Measure | Value |
|---|---|
| Mean height, men 20+ | 68.9 inches (5’8.9″) |
| 25th percentile | 66.9 inches |
| Median | 69.0 inches |
| 75th percentile | 70.9 inches |
| 90th percentile | 72.7 inches |
| 95th percentile | 73.7 inches |
That 90th percentile figure is the one to sit with. Six foot one is roughly the 90th percentile of American men. Six feet flat is lower than most people assume.
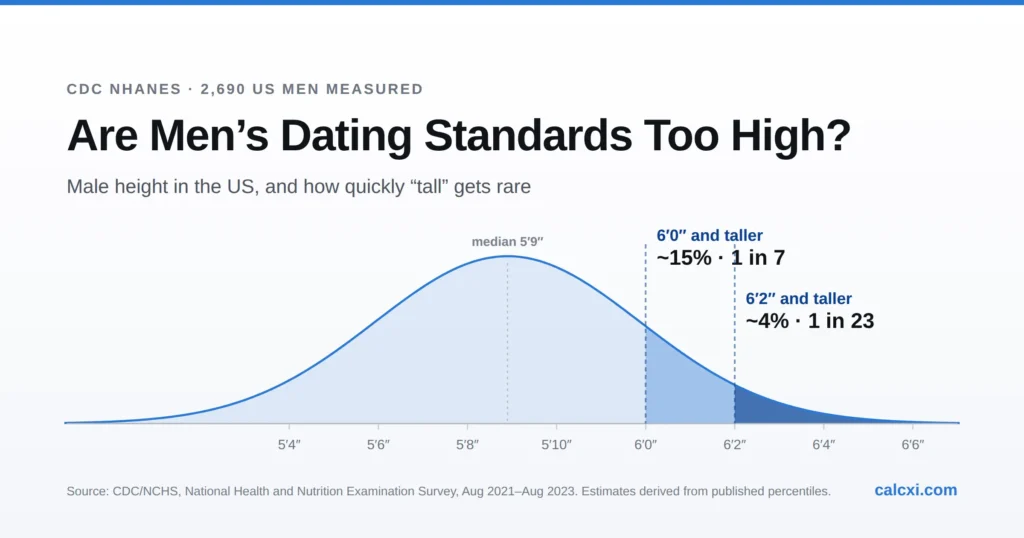
How rare is a six-foot man?
Male height follows a normal distribution closely. Fitting one to the CDC’s published percentiles produces a model that matches their reported values at every single checkpoint the 25th, 50th, 75th, 90th and 95th percentiles all land within a tenth of an inch. That’s a good enough fit to estimate the tails.
| Height threshold | Estimated share of US men 20+ | Roughly |
|---|---|---|
| 5’10” and taller | ~36% | 1 in 3 |
| 6’0″ and taller | ~15% | 1 in 7 |
| 6’2″ and taller | ~4% | 1 in 23 |
| 6’4″ and taller | ~1% | 1 in 115 |
Derived from CDC NHANES August 2021–August 2023 percentile data for men 20+. Estimates not measured counts.
Note what happens between six feet and six foot two. Adding two inches to a requirement cuts the qualifying group by roughly three quarters. That’s the compounding problem in miniature, and it’s why we’ve written separately on what share of American men are over 6 feet tall and on average male height in the US, where the age and ethnicity breakdowns matter more than a single national figure suggests.
One caveat that applies to every online height discussion: men over-report their height by roughly half an inch to an inch on average. The CDC numbers are measured. Dating profile numbers are not.
If height is one filter among several you’re weighing, the Female Delusion Calculator will run it against census and CDC data alongside your other criteria, rather than making you estimate the combined effect by hand.
The $100K Standard: Why the Number Depends on the Denominator
You’ll see “25% of American men earn over $100,000” quoted constantly. You’ll also see 16%. Both can be sourced. The difference is entirely in who’s being counted.
Three different denominators are in circulation:
| Population counted | Approximate share earning $100K+ |
|---|---|
| All individual US workers | ~23% ($100,000 sits near the 77th percentile) |
| Working men specifically | roughly 1 in 4 |
| All adult men, including students, retirees and non-workers | Meaningfully lower |
Median individual income for American men who work was about $60,110 for 2024. A six-figure requirement isn’t a modest step above typical. It’s roughly a doubling of the median.
Two further complications. Older analyses reporting 16% used 2019 dollars, when $100,000 bought about what $125,000 buys now, so they aren’t measuring the same bar. And individual income is not household income: household figures run far higher and get quoted interchangeably by people who haven’t checked.
Age matters more than almost any other factor here. Six-figure earners are concentrated in the 35–54 range. A woman applying a $100K filter to men in their mid-twenties is filtering against a much smaller share than the national number implies. Our breakdown of how common a six-figure income is among American men covers the age, education and state variation in detail.
The 6-6-6 Rule
The 6-6-6 rule is an internet shorthand for a partner who is at least six feet tall, earns at least six figures, and has six-pack abs. Some versions swap in a different third six. It circulates as a meme, a joke, and an accusation, depending on who’s using it.
Two things are worth stating plainly.
First, there’s no evidence this is a widespread standard anyone actually applies. Even Psychology Today’s coverage of the rule concedes it’s difficult to tell how many women use it. It’s a viral formulation, not a measured behavior, and treating it as a documented dating trend would be a mistake.
Second, if someone did apply it strictly, the arithmetic gets thin fast. Around 15% of American men clear six feet. Around a quarter of working men clear six figures. Visible abs are rarer than either and aren’t tracked by any national survey, so no honest estimate exists for the third criterion.
Even setting the abs aside and treating the first two as independent, you’re at roughly 3–4% of men, about 1 in 27. Layer in an age range and a relationship-status filter and it drops further.
That’s a useful illustration of compounding. It is not a measurement of anyone’s real dating pool, for reasons the next two sections cover.
How Combining Standards Shrinks a Dating Pool
This is the part that surprises people, and it’s genuinely counterintuitive.
Individual requirements usually sound modest. Combined, they multiply rather than add.
| Requirement | Approximate share of US men | Running estimate |
|---|---|---|
| 6’0″ or taller | ~15% | ~15% |
| …and earns $100K+ | ~25% of working men | ~3.7% |
| …and is not currently married | roughly half, depending on age | ~1.9% |
Illustrative estimate assuming the traits are independent. Real prevalence differs; see below.
Three requirements, none of which sounds extreme in isolation, and the theoretical pool is down to around 1 in 50 men. Nobody experiences this consciously. You don’t feel a pool shrinking; you just notice that dating is going badly and reach for an explanation.
Why simple multiplication is only a rough guide
Almost every dating-pool calculation you’ll encounter online multiplies percentages together and presents the result as fact. That method assumes the traits are independent of one another, and they aren’t.
Height and income are positively correlated. Economists Anne Case, Christina Paxson and Mahnaz Islam found roughly a 1.5% wage premium per additional inch of height, with about half of that explained by height’s association with educational attainment. Education and income are correlated much more strongly still.
The consequence is specific and it cuts against the alarming direction: when traits are positively correlated, multiplying independent probabilities understates the true joint share. Tall men are somewhat more likely to be high earners than a random man is, so the real count of tall high earners is higher than 15% × 25% suggests.
Other factors push the opposite way. Narrow the age range and you cut into both groups unevenly. Restrict to one metro area and local demographics take over entirely.
So treat any single multiplied figure as an order of magnitude, not a measurement. It tells you whether you’re looking at something common, uncommon, or rare. It doesn’t tell you the exact number, and anyone presenting it to three decimal places is overselling.
Rather than estimating your own combination by hand, you can test your specific criteria against US population data and watch how the number moves as you adjust one filter at a time. Changing a single requirement is usually more informative than the starting figure.
Theoretical Pool vs. Actual Dating Pool
Everything above describes a theoretical population pool, meaning the share of American men with certain characteristics. Your actual dating pool is much smaller, and the gap between them is large enough that conflating the two would be misleading.
The theoretical pool ignores all of the following: where you live, whether the man is in your age range, whether he’s single, his orientation, whether he’s dating at all, whether he’d be interested in you, and whether you’d be interested in him once you met.
That last pair matters most. Pew found that among single Americans, 57% weren’t looking for a relationship or dates at all. The pool of people who match your criteria and are actively dating is a fraction of the population figure.
None of this makes population statistics useless. It makes them a floor rather than a forecast. If a combination of requirements already puts you at 1% of men nationally, geography and mutual interest can only take that down.
Do Dating Apps Make People Pickier?
Apps change how selectivity gets expressed more than how selective people are.
Pew’s 2022 survey of 6,034 US adults found the experience splits sharply by sex. 64% of male users said they felt insecure because of a lack of messages at least sometimes. 54% of female users said they felt overwhelmed by the volume of messages they received. Same platform, opposite problems.
That asymmetry produces the behavior that gets misread as high standards. The July 2025 PLOS One study by Renata Topinkova and Tomas Diviak analyzed roughly 3,000 heterosexual users and found men tended to swipe right on women rated more attractive than themselves, while women swiped more laterally or slightly downward. Successful matches tracked women’s patterns more closely than men’s.
Coverage of this study ran under headlines about men needing to lower their standards. Two corrections are worth making. The study used data from a Czech dating app, not a US one, so it may or may not generalize to American users. And swiping right on nearly everyone, including people above your own rated desirability, is low selectivity combined with high aspiration. Those are different things. A man who swipes on almost every profile is being less picky than a woman who swipes on few his match rate is low because of reciprocity, not because his standards are high.
What apps genuinely do change is the format of the decision. A swipe is a judgment made in about a second on photographs, which structurally elevates whatever is visible in a photo, height, build, face over everything that isn’t. It’s not that people became shallower. It’s that the interface only shows them the shallow information first.
Are Modern Standards Actually Higher Than They Used To Be?
Probably in some respects, though the evidence is thinner than the confident takes suggest.
What’s genuinely changed: women’s financial independence has removed economic necessity as a reason to partner, which raises the bar a relationship has to clear to be worth having. Expectations of emotional labor and communication in relationships have risen for both sexes. Apps have made the apparent supply of alternatives enormous, and choice overload is a well-documented effect.
What hasn’t been established: that any of this translates into measurably higher trait requirements than a generation ago. Comparable longitudinal data on stated standards is scarce, and social media makes extreme standards far more visible without necessarily making them more common. A viral video of someone listing outlandish requirements is evidence that the video exists, not that the requirement is widespread.
The 6-6-6 rule is a good example. Enormous cultural footprint, no measurement of how many people actually apply it.
When Do Standards Become Unrealistic?
There’s no threshold percentage at which standards become objectively wrong. But a few patterns reliably predict frustration.
Requiring many unrelated traits at once is the main one, because that’s where compounding happens invisibly. Weighting rare, visible traits over the ones that predict whether a relationship works, kindness, reliability, emotional stability, shared goals is another. Refusing any tradeoff is a third: someone who won’t accept 5’11” and won’t accept $90,000 and won’t accept a 3-year age gap has functionally stacked three filters they think of as one.
The most useful check is the reciprocity test. Would you clear the bar you’re setting? Not identically, since the point isn’t symmetry of traits, but comparably. Someone requiring the top 5% on several dimensions while offering the median on all of them will have a hard time, and no amount of arguing about standards changes the arithmetic.
The alternative isn’t “lower your standards.” It’s prioritization: decide which two or three things genuinely determine whether a relationship works for you, hold those firmly, and let the rest be preferences you’d enjoy rather than filters you enforce.
Does a Low Percentage Mean Your Standards Are Wrong?
No, and this is worth being clear about because it’s the easiest thing to get wrong about population math.
A rarity calculator measures how statistically uncommon a combination is. That’s all it measures. It doesn’t measure whether a preference is reasonable, fair, shallow, or justified. Those are questions about values, and no dataset answers them.
A 2% result means your combination describes about 2 in 100 American men. It doesn’t mean you’re being unreasonable. Plenty of people successfully partner with someone in a small statistical minority, because most people aren’t running an exhaustive national search, they’re meeting a manageable number of people and forming attachments that don’t reduce to a checklist.
What the number is genuinely useful for is calibration. If a combination is rare, that’s worth knowing, because it tells you the search will take longer and that flexibility on the least important filter buys disproportionate room. Someone at 1% who relaxes a single requirement often finds themselves at 5% or 8%, which is a different search entirely.
That’s the honest use of a tool like this: a reality check on effort required, not a verdict on character. You can see how your own combination scores and, more usefully, watch what happens when you move one filter at a time.
The same logic applies in reverse. Men who want to check their own preferences around age, education, body type or lifestyle can run the same analysis against female population data using the calculator’s Male Standards mode. The math doesn’t care which direction you point it, and a man requiring a narrow age band plus specific physical criteria plus a particular education level is stacking filters exactly the way anyone else does.
So, Are Men's Dating Standards Too High?
As a general claim about American men, the evidence doesn’t support it. On the standards that dominate the argument (income, employment, education, height) US surveys find women reporting stricter requirements than men, sometimes by very large margins. Men are more selective about age and physical attractiveness, which is real, but it isn’t what people usually mean when they make the accusation.
The dating-app research that produced the “men should lower their standards” headlines was measuring aspirational swiping in the Czech Republic, and aspirational swiping is close to the opposite of selectivity.
None of which means men have no unrealistic expectations. Some do. So do some women. The pattern that actually predicts frustration isn’t gender. It’s stacking multiple requirements without noticing that each one multiplies against the last, and weighting rare visible traits above the ordinary ones that determine whether a relationship works.
Which is why “are men’s standards too high?” is the wrong question. It’s an argument about groups that can’t be settled and wouldn’t help you if it were. “How realistic is my particular combination of requirements, and which one could I loosen for the most benefit?” is a question with an actual answer, and it’s the one worth asking.
Frequently Asked Questions
Are men's dating standards too high?
There’s no strong evidence that American men as a group have unusually high standards. US surveys generally find women reporting stricter requirements on income, employment, education and height. Men tend to be more selective about age and physical appearance. Whether any individual’s standards are unrealistic depends on how rare their specific combination of requirements is.
Are men or women more selective in dating?
It depends on the trait. The Survey Center on American Life found 81% of women versus 56% of men would be less likely to date someone without a job, and 56% of women versus 11% of men would avoid dating someone much shorter. Men show more selectivity around age and physical attractiveness. Neither sex is uniformly pickier.
What percentage of American men are over 6 feet tall?
Roughly 15%, or about 1 in 7. This is estimated from CDC NHANES data collected between August 2021 and August 2023, which measured 2,690 men aged 20 and over and found a mean height of 68.9 inches. About 4% of men reach 6’2″ and roughly 1% reach 6’4″.
How many American men earn $100,000 or more?
Roughly 1 in 4 working men, though the figure shifts a lot depending on who is counted. Across all individual US workers, $100,000 sits near the 77th percentile. Across all adult men including students, retirees and non-workers, the share is meaningfully lower. Median individual income for men who work was about $60,110 in 2024.
What is the 6-6-6 dating rule?
It’s internet shorthand for wanting a partner at least six feet tall, earning six figures, with six-pack abs. It circulates widely as a meme, but there’s no evidence it’s a standard many people actually apply. Combining just the first two criteria describes roughly 3–4% of men.
Does having too many standards reduce your dating pool?
Substantially, because requirements multiply rather than add. Three individually moderate requirements – six feet tall, six-figure income, not currently married, describe roughly 2% of American men when combined, even though each sounds unremarkable alone.
Do dating apps make people more selective?
Apps change how selectivity is expressed more than how selective people are. A swipe is a one-second judgment made on photographs, which structurally elevates visible traits over everything else. Pew found 64% of male users felt insecure over a lack of messages while 54% of female users felt overwhelmed by message volume.
Why do men get fewer matches on dating apps?
Largely reciprocity and platform sex ratios rather than standards. Research on swiping behavior finds men tend to swipe right far more broadly, including on profiles rated more desirable than their own, which lowers the match rate. That’s low selectivity paired with high aspiration, not high standards.
What makes dating standards unrealistic?
Usually the number of requirements rather than any single one. Warning signs include stacking many unrelated traits, prioritizing rare visible characteristics over the ones that predict relationship success, refusing any tradeoff, and applying a bar you wouldn’t meet yourself.
Do people actually date according to their stated preferences?
Often not. Eastwick and Finkel’s 2008 speed-dating study found participants’ stated preferences replicated the usual sex differences but were unrelated to who they actually became romantically interested in. It’s a reason to treat any survey of stated standards, including favorable ones, with some caution.
What does the Female Delusion Calculator measure?
It estimates what share of the US population matches a chosen set of criteria age, height, income, marital status, education and lifestyle filters using Census Bureau and CDC data. It measures statistical rarity only. A low percentage means a combination is uncommon, not that a preference is wrong.
How can I tell how rare my dating preferences are?
Run them against population data rather than estimating. The most informative approach is adjusting one filter at a time to see which requirement is costing you the most, since relaxing a single low-priority criterion often changes the result more than people expect.

Written & verified by
B.Tech Computer Science · 8 years in web development & SEO · Bhilwara, India
About ·
LinkedIn ·
Report an error