Cumulative Abnormal Return Calculator
Use this cumulative abnormal return calculator to measure how a stock performed around a specific event compared with its expected return. This CAR calculator can help you calculate abnormal returns, running CAR, CAPM expected return, event-window results, and downloadable charts from your stock and market data.
This tool is part of the CalcXi calculators‘ collection, built to make finance and research calculations easier online.
Upload your CSV data, choose an event date, select the return model, and calculate the stock’s abnormal performance before and after the event.
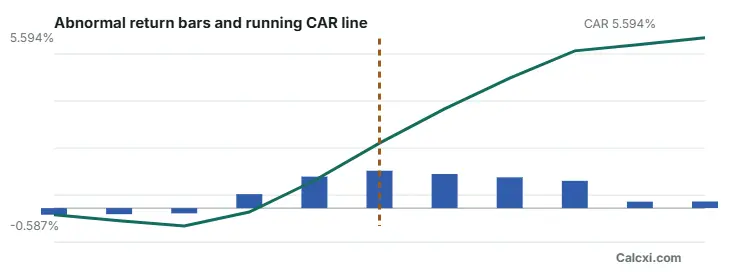
CAR Chart
Event Window Table
Swipe left/right to view all columns.
| Date | t | Stock return | Market return | Expected | Abnormal | Running CAR |
|---|---|---|---|---|---|---|
| Load sample data or paste your CSV, then calculate. | ||||||
What Is Cumulative Abnormal Return?
Cumulative abnormal return, also called CAR, is the total abnormal return of a stock over a selected event window. It is commonly used in event studies to measure whether a company event, news announcement, or market event had an unusual effect on stock performance.
In simple terms, CAR answers this question:
Did the stock move differently than expected around the event?
The basic idea is:
Abnormal Return = Actual Return – Expected Return
Then CAR adds all abnormal returns across the event window:
CAR = Sum of Abnormal Returns
If CAR is positive, the stock performed better than expected during the event window. If CAR is negative, the stock performed worse than expected.
How to Use the Cumulative Abnormal Return Calculator
Using this CAR event study calculator is simple:
- Upload your CSV data or use the sample data.
- Choose whether your data contains prices or returns.
- Select the expected return model: CAPM, market-adjusted, or mean-adjusted.
- Enter the event date.
- Set the estimation window and event window.
- Click Calculate CAR.
- Download the results CSV or CAR chart.
The calculator will generate a row-by-row event window table showing stock return, market return, expected return, abnormal return, and running CAR.
Cumulative Abnormal Return Formula
The cumulative abnormal return formula is:
CAR = Σ ARt
Where:
Meaning:
- ARt = abnormal return on day t
- Rt = actual stock return on day t
- E(Rt) = expected stock return on day t
So, the full formula is:
CAR = Σ [Actual Return – Expected Return]
This abnormal return calculator first calculates the abnormal return for each day in the event window, then adds those values together to calculate cumulative abnormal return.
CAPM Expected Return in CAR Calculation
This tool can also work as a CAPM abnormal return calculator.
When you choose the CAPM model, the calculator estimates expected return using the Capital Asset Pricing Model:
Expected Return = Risk-Free Rate + Beta × (Market Return – Risk-Free Rate)
The calculator uses your estimation window to estimate beta, then applies that beta to calculate expected returns during the event window.
This is useful when you want a more finance-based expected return instead of simply comparing the stock return to the market return.
What Is an Event Window?
An event window is the period around an event date that you want to study.
For example, if the event date is the earnings announcement date, you may want to calculate CAR from five trading days before the event to five trading days after the event.
Example:
Event window = -5 to +5
This means the calculator looks at returns from five trading days before the event through five trading days after the event.
Common event windows include:
- -1 to +1
- -3 to +3
- -5 to +5
- -10 to +10
A shorter event window is useful when you want to measure a quick market reaction. A longer event window can help capture delayed reactions.
What CSV Format Is Required?
Your CSV file should include these columns:
date,stock,market,rf
2026-01-02,100,5000,0.0001
Column meaning:
- date = trading date
- stock = stock price or stock return
- market = market index price or market return
- rf = risk-free rate, optional
The rf column is optional. If it is not included, the calculator can use the daily risk-free rate entered in the tool.
You can use either prices or decimal returns. Just make sure you select the correct data type before calculating.
What Results Does This CAR Calculator Provide?
After calculation, the tool provides:
- Final cumulative abnormal return
- Beta
- Alpha
- Number of event-window rows
- Stock return
- Market return
- Expected return
- Abnormal return
- Running CAR
- Event-window table
- Downloadable CSV results
- Downloadable CAR chart
The event-window table helps you see exactly how CAR builds day by day. The chart gives a visual view of abnormal returns and running CAR across the event window.
When Should You Use a CAR Event Study Calculator?
You can use a cumulative abnormal return calculator when you want to measure how a stock reacted to a specific event.
Common examples include:
- Earnings announcements
- Mergers and acquisitions
- Dividend announcements
- CEO changes
- Product launches
- Legal decisions
- Stock splits
- Regulatory announcements
- Interest rate or policy announcements
Researchers, students, analysts, and investors often use CAR in event studies to understand whether an event created unusual stock performance.
CAR Calculator vs Abnormal Return Calculator
An abnormal return calculator measures the difference between actual return and expected return for one day or one period.
A CAR calculator goes one step further. It adds abnormal returns across multiple days in the event window.
Simple difference:
Abnormal Return = one day or one period
CAR = total abnormal return across the full event window
So if you want to study one day only, abnormal return may be enough. But if you want to measure the full impact before and after an event, cumulative abnormal return is more useful.
Frequently Asked Questions
What is a cumulative abnormal return calculator?
A cumulative abnormal return calculator is a tool that calculates the total abnormal return of a stock over an event window. It compares actual stock returns with expected returns and adds the abnormal returns together to calculate CAR.
How do you calculate cumulative abnormal return?
You calculate cumulative abnormal return by subtracting expected return from actual return for each day, then adding those abnormal returns across the event window.
CAR = Σ (Actual Return – Expected Return)
What is the difference between abnormal return and CAR?
Abnormal return measures the unusual return for one day or period. CAR measures the total abnormal return across several days in an event window.
What is a good event window for CAR?
A common event window for CAR is -5 to +5 trading days around the event date. Shorter windows like -1 to +1 are useful for immediate market reactions, while longer windows can capture delayed effects.
Can I calculate CAR using CAPM?
Yes. This calculator supports CAPM expected return. It uses beta, market return, and risk-free rate to estimate expected return, then calculates abnormal return and CAR.
Can I upload CSV data to calculate CAR?
Yes. You can upload CSV data with date, stock, market, and optional risk-free rate columns. The tool will read your data and calculate CAR based on your selected event date and event window.
Can I download the CAR chart?
Yes. You can download the CAR chart as a PNG image. This is useful for reports, research papers, assignments, and presentations.
Is cumulative abnormal return used in event studies?
Yes. Cumulative abnormal return is one of the most common measures used in event studies. It helps measure whether a stock had an unusual return around a specific event.